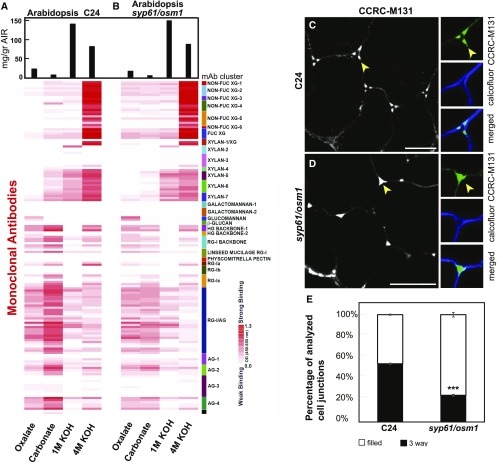
Figure 4.
Distinct Cell Wall Glycome Profiles and Patterns between Wild Type and the syp61/osm1 Mutants.
(A) and (B) Cell wall glycome profiling of wild type C24 (A) and of mutant seedlings (B). Sequentially extracted cell wall material was analyzed using glycome profiling with the glycan-directed mAbs as described in Figure 3C. A white-to-red scale indicates signal intensity in the ELISA heatmap as described before. Black bars at the top indicate milligram per gram of cell wall AIR. In each lane, 0.3 μg of Glc equivalent amounts of polysaccharides was applied. The heatmap is a visual representation of Supplemental Data Set 5.
(C) Pectin backbone labeling with CCRC-M131 in the C24 wild type background. CCRC-M131 labeling showed a distinct three-way junction pattern (arrow) in the C24 control. Insets show a close-up view of a three-way junction pattern. Green indicates staining with CCRC-M131, and blue represents cellulose staining with calcofluor white.
(D) Pectin backbone labeling with CCRC-M131 in syp61/osm1 roots. Labeling with CCRC-M131 in the syp61/osm1 mutant displays mostly a filled junction pattern (arrow) forming a different outline compared with the control. Insets show a filled junction in cell corners. Green indicates staining with CCRC-M131, and blue represents cellulose staining with calcofluor white. Images in (C) and (D) represent transverse root tip sections. Bars = 10 μm.
(E) Quantification of three-way junction labeling versus filled junction by CCRC-M131. The percentage of total analyzed cell corners displaying a three-way junction labeled by CCRC-M131 is reduced in the syp61/osm1 mutant compared with the wild type control C24 (t test, ***P < 0.001). The percentage of total cell corners displaying a filled junction pattern labeled by CCRC-M131 is significantly higher in the syp61/osm1 compared with the wild type control C24 (t test, ***P < 0.001). Thin bars represent se.

