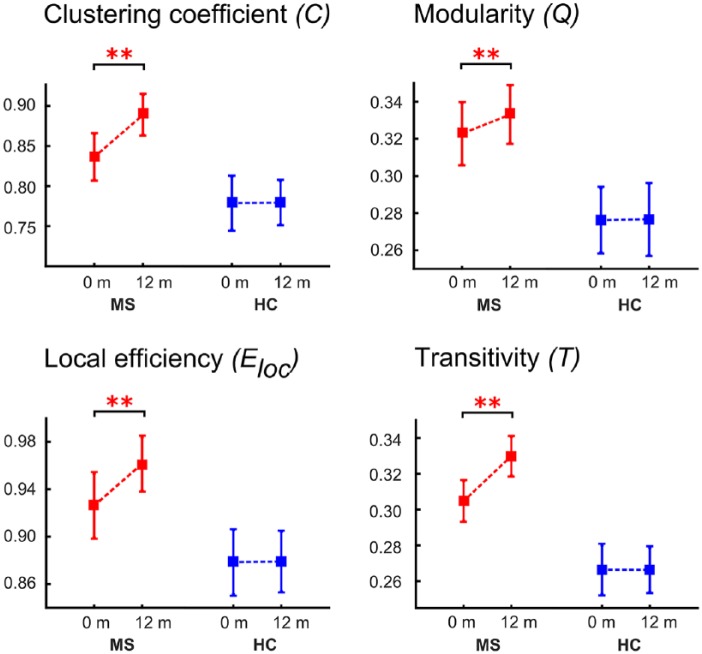
Figure 3.
Longitudinal network measures of multiple sclerosis (MS) patients and healthy controls.
The plots show the estimated mean and standard deviation values at the two time points for the measures clustering coefficient, modularity, local efficiency, and transitivity for the cortical thickness analyses (**p < 0.001).

