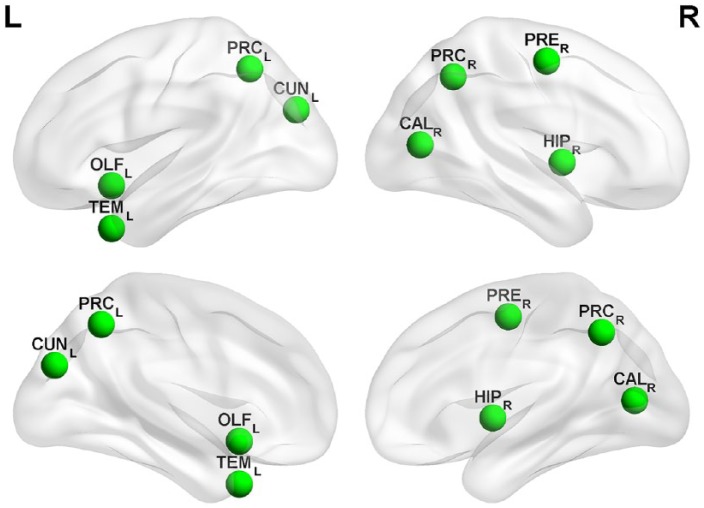
Figure 4.
Topological representation of restructured clusters.
Topological representation of clustering coefficient changes between baseline (0 months) and the last time point (12 months). Regions with the highest clustering coefficient changes over time (only clusters above the 95% confidence interval are shown) as a marker of local reorganization.
CUNL, cuneus (left); OLFL, olfactory cortex (left); TEML, middle temporal gyrus (left); CALR, calcarine cortex (right); HIPR, hippocampus (right); PRCL, precuneus (left); PRCR, precuneus (right); PRER, precentral gyrus (right).

