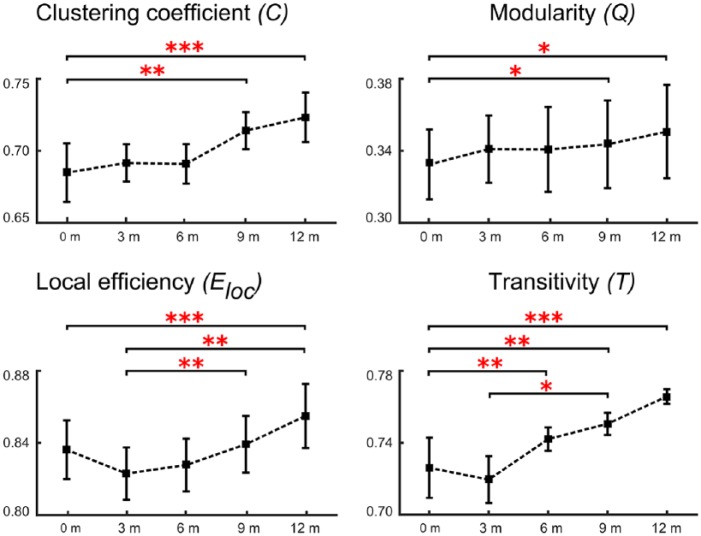
Figure 6.
Longitudinal short-term network measures of multiple sclerosis (MS) patients scanned every 3 months.
The plots show the estimated mean and standard deviation values at the five time points for the measures clustering coefficient, modularity, local efficiency, and transitivity for the cortical thickness analyses. (*p < 0.01; **p < 0.001; ***p < 0.0001).

