
. 2019 Apr 23;15:1176934319843515. doi: 10.1177/1176934319843515
© The Author(s) 2019
This article is distributed under the terms of the Creative Commons Attribution-NonCommercial 4.0 License (http://www.creativecommons.org/licenses/by-nc/4.0/) which permits non-commercial use, reproduction and distribution of the work without further permission provided the original work is attributed as specified on the SAGE and Open Access pages (https://us.sagepub.com/en-us/nam/open-access-at-sage).
Figure 4.
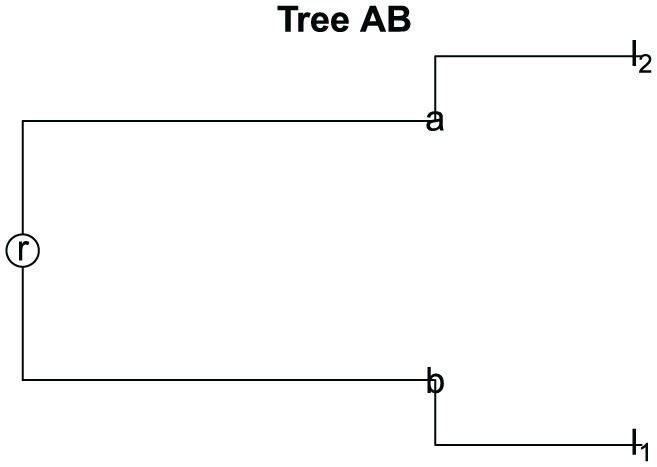
Tree for samples and .