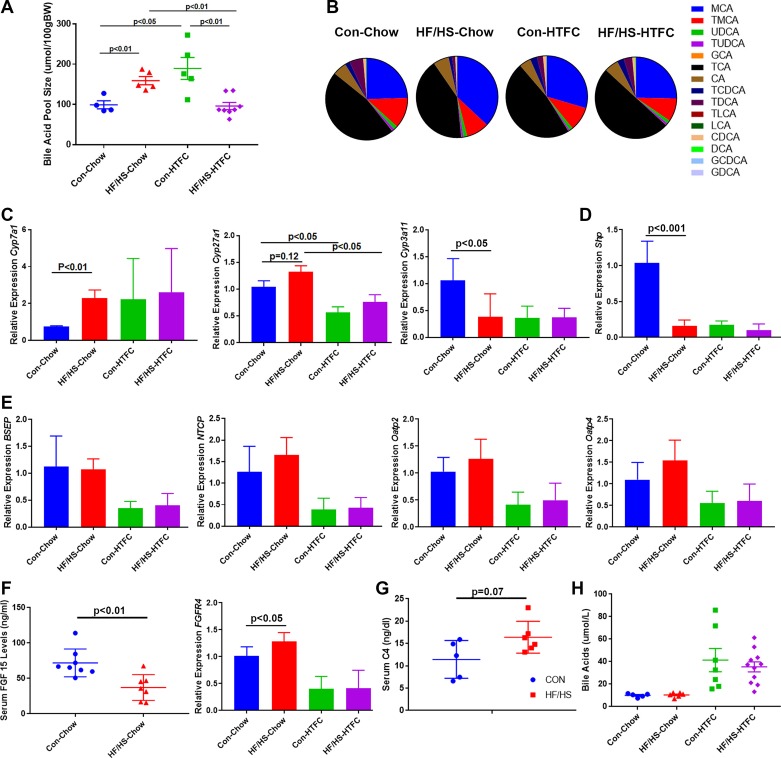
Fig. 7.
Bile acid (BA) homeostasis in F1 offspring during Western diet feeding. A: BA pool size in offspring fed chow or high-transfat, cholesterol, fructose (HTFC) diet. B: intrahepatic BA composition (%total) with key to individual species on right. C: quantitative PCR for Cyp7a1, Cyp27a1, and Cyp3a11 from liver of offspring fed chow or HTFC diet. Levels are presented as fold change to maternal control (CON) chow-fed group as control. D: quantitative PCR (qPCR) for small heterodimer protein (Shp) from liver of offspring fed chow or HTFC diets. Levels are presented as fold change to maternal CON chow-fed group as control. E: qPCR for several BA transporters (BSEP, NTCP, Oatp2, and Oatp4) from liver of offspring fed chow or HTFC diet. Levels are presented as fold change to maternal CON chow-fed group as control. F: serum fibroblast growth factor 15 (FGF15) levels (left) and qPCR for liver fibroblast growth factor receptor 4 (FGFR4, right). G: serum levels of 7α-hydroxy-4-cholesten-3-one (C-4) from offspring of maternal CON or fed high-fat/high-sucrose (HF/HS) diet lineage-fed chow diet. H: circulating BAs in offspring fed chow or HTFC diet. Quantitative data are presented as means ± SD with n ≥ 4 in each group. For BA pool size, ≥4 separate litters are represented in each group. For all other data, ≥6 separate litters are represented in each group. P values are as noted on each graph. All data are from male offspring.

