Fig. 7.

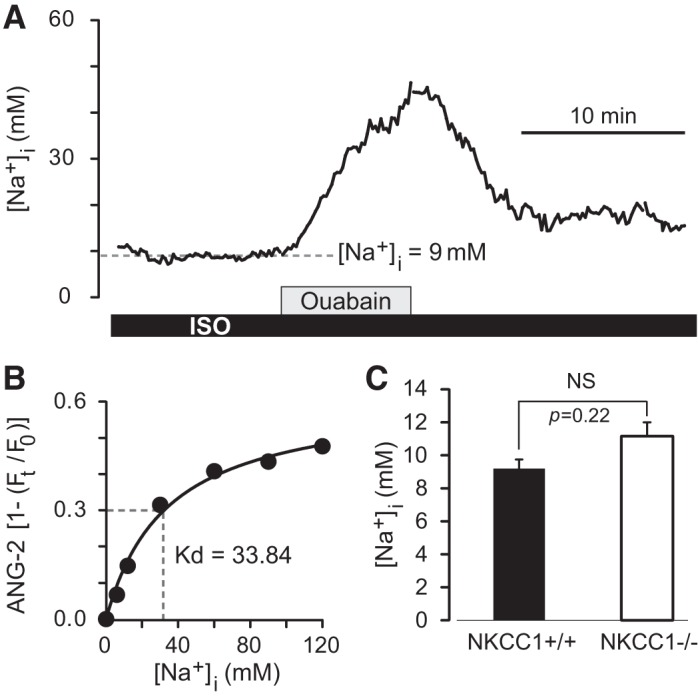
Basal intracellular Na+ concentration ([Na+]i) in single choroid plexus epithelial cells (CPECs) measured with the fluorescent indicator Asante NaTRIUM Green-2 (ANG-2). A: example of a recording of basal [Na+]i in an ANG-2-loaded CPEC from a wild-type (NKCC1+/+) mouse, (postnatal day 21, male). Na+-K+ pump was inhibited with ouabain (1 mM) to test that the dye responded to changes in [Na+]i. Basal [Na+]i in this CPEC was 9 mM and increased to ~45 mM during ouabain exposure at an initial rate (d[Na+]i/dt) of 6.5 mM·min−1. Ouabain-induced increase in [Na+]i was reversible on removal of the pump inhibitor. ISO, isosmotic control solution. B: at the end of the observation period each ANG-2-loaded CPEC was calibrated in situ to determine the apparent Kd for Na+ and the maximal normalized fluorescence intensity value Fmax by fitting the Michaelis-Menten equation to the data points. Minimal normalized fluorescence Fmin, the fluorescence recorded in the 0Na+ calibration solution, was adjusted to 0 (after background subtraction). Graph shows the relative fluorescence intensity [1(Ft/F0)] of ANG-2 as a function of [Na+]i from the CPEC in A. F0, steady-state fluorescence; Ft, fluorescence recorded with respect to time. From the Michaelis-Menten fitted to the data points the apparent Kd for Na+ (33.84 mM) and Fmax (0.61) were obtained. Parameters obtained from each cell were used to convert ANG-2 fluorescence intensities into [Na+]i using Eq. 5. C: basal [Na+]i in NKCC1+/+ and NKCC1−/− CPECs. Average basal [Na+]i in NKCC1+/+ cells (black bar) was 9.2 mM (SD 2.5 mM, SEM 0.6 mM, n = 21 cells, 3 mice, 1 male and 2 female). Average basal [Na+]i in NKCC1−/− cells was 11.1 mM (SD 3.9 mM, SEM 0.8 mM, n = 21 cells, 3 mice, 1 male and 2 female). Difference between means was not significant (NS; P = 0.22).
