Figure 5.

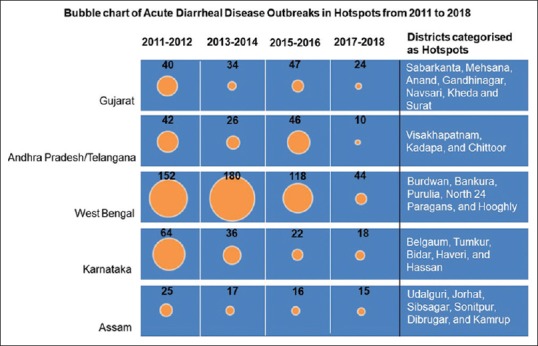
Bubble chart representing total acute diarrheal disease outbreaks for the districts categorised as hotspots in five states

Bubble chart representing total acute diarrheal disease outbreaks for the districts categorised as hotspots in five states