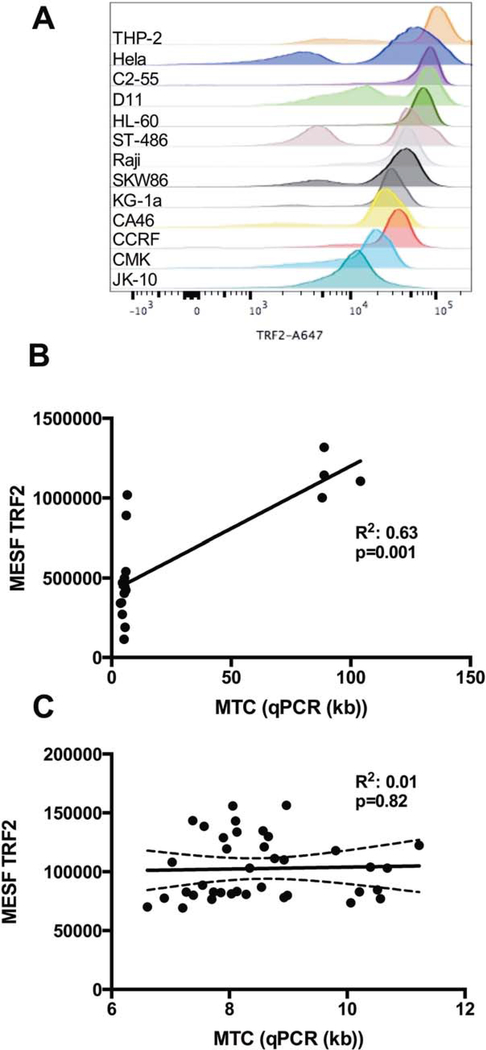
Figure 6.
TRF2 measurements in different cell lines and PBMCs. A. TRF2 measurements of different cell lines, representation of A647 fluorescence intensity (from top to bottom, THP2, Hela, C2–55, D11, HL-60, ST486, Raji, SKW86, KG-1a, CA46, CCRF, CMK, JK-10.) B. Comparison of MTC measured with qPCR vs. MESF of TRF2 of cell lines. C. Comparison of MTC measured with qPCR in PBMC samples vs. MESF of TRF2 for all cell types.

