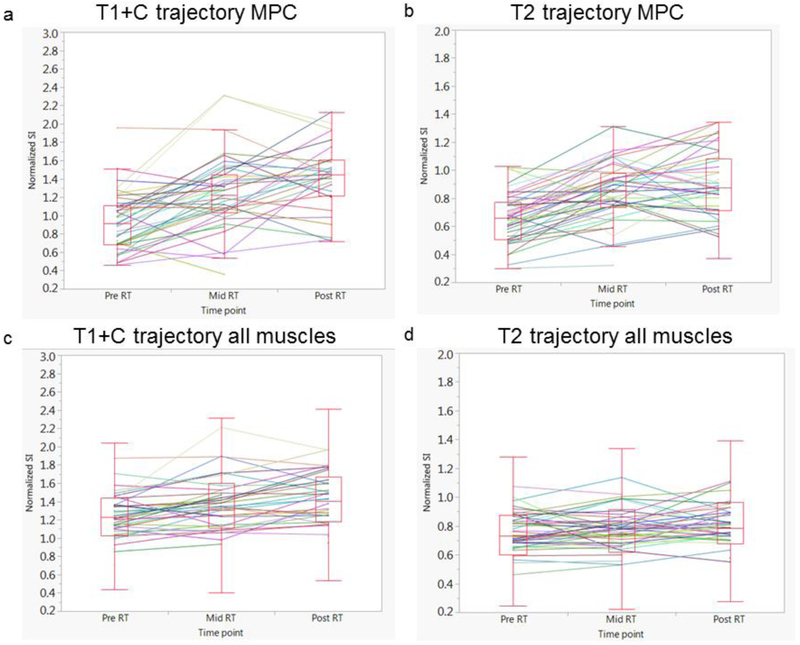
Figure 2.
Box plots depicting the distribution of normalized signal intensity over time. There is an overall significant increase in normalized SI over time of MPC muscle in T1+C (a) and T2 (b) sequences at both mid- and post-RT relative to baseline values (p< 0.001 for both), as well as in all the muscles grouped together in T1+C (c) and T2 (d) sequences (p< 0.001 for both). The solid lines depict the trajectory at the individual patient level.

