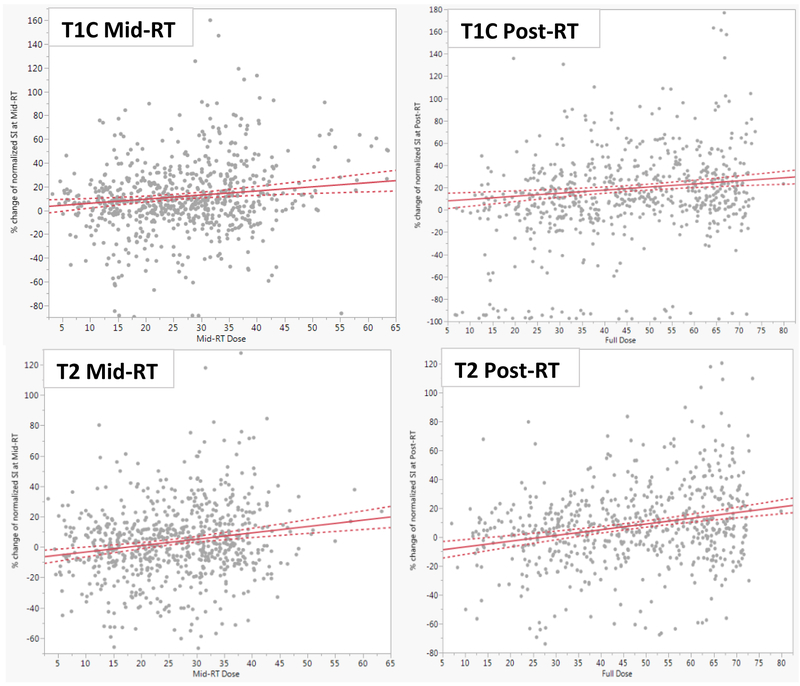
Figure 3.
Linear regression analyses identified positive correlations between the dose received at Mid- (left column) and Post-RT (right column) by the grouped muscle VOIs and the normalized SI of T1+C (upper row) and T2 (lower row) images. The dose received at mid-RT was significantly correlated, with the percent change of normalized T1+C and T2 SI for the muscle VOIs (r=0.14, R-square 0.02, p=0.002 and r=0.2, R-square 0.04, p<0.0001) respectively. Full dose was also significantly correlated with the percent change of T1+C (r=0.14, R-square 0.02, P= 0.0004) and T2 SI (r=0.24, R-square 0.06; p<0.0001)

