. 2019 Mar 18;10(16):4377–4388. doi: 10.1039/c8sc05340e

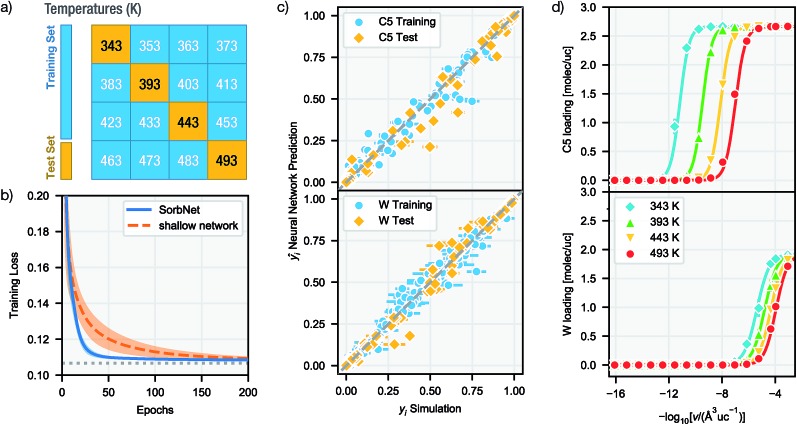
Fig. 2. Deep NN learning of the MFI-C5-W desorption simulation system. (a) The training/test temperature allocation. (b) Learning curves of SorbNet and a shallow NN with the same parameter complexity. The dotted horizontal line denote minimum training loss attainable by predicting the averaged result for each group of independent simulations. (c) Scatter plot of SorbNet predictions for C5 (top) and W (bottom) fractional loadings for training and test temperatures versus fractional loadings obtained from simulations. (d) Loading-volume sorption isotherms of the MFI-C5-W system at test-set temperatures and an initial loading of C5 : W = 2.67 : 1.92 (molec/uc). Symbols denote simulation data and lines denote NN predictions. Abbreviations: molec – molecule; uc – unit cell.

Fig. 2