FIG 1.
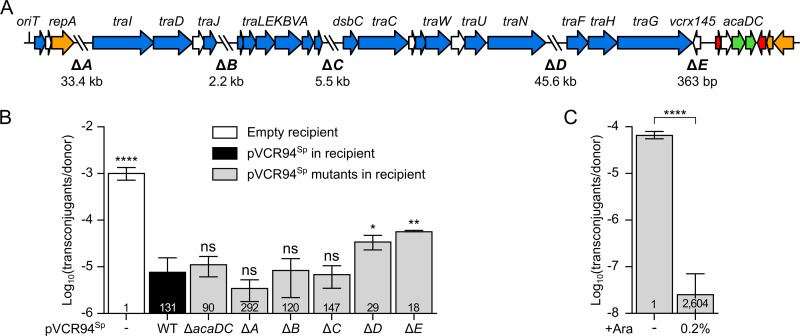
Mapping of IncC exclusion functions. (A) Linear schematic representation of pVCR94ΔX gene map. The positions and orientations of open reading frames (ORFs) are indicated by arrows. Colors depict the function deduced from functional analyses and BLAST comparisons as follows: orange, replication and partition; blue, conjugative transfer; red, transcriptional repression; green, transcriptional activation; white, unknown function. The positions of fragments deleted in pVCR94Sp (ΔA to ΔE) are indicated by backslashes, and lengths of deletions are indicated below the schematic representation. (B) Exclusion of pClo transferred from a donor strain bearing pVCR94Kn by a set of deletion mutants of pVCR94Sp in recipient cells. The donor strain was E. coli VB112 bearing pVCR94Kn and pClo (Apr). All recipient strains were derivatives of E. coli GG56 that were either plasmid free (−) or bearing pVCR94Sp (wild type [WT]) or its deletion mutants. (C) Expression of eexC (vcrx145) in a recipient strain is sufficient to exclude transfer of pVCR94Sp. The donor strain E. coli GG56 bearing pVCR94Sp was mated with E. coli CAG18439 carrying peexC as the recipient without or with arabinose (+Ara). Each bar represents the mean of results from three independent experiments, with error bars indicating the standard deviations. Exclusion indices (EI) are indicated at the bottom of each bar. Statistical analyses were carried out on the logarithm of the values using one-way analysis of variance (ANOVA) with Dunnett’s multiple-comparison test (B) and an unpaired t test (two-tailed) (C) to compare induced transfer and noninduced transfer. Statistical significance is indicated as follows: ****, P < 0.0001; **, P < 0.01; *, P < 0.05; ns, not significant.

