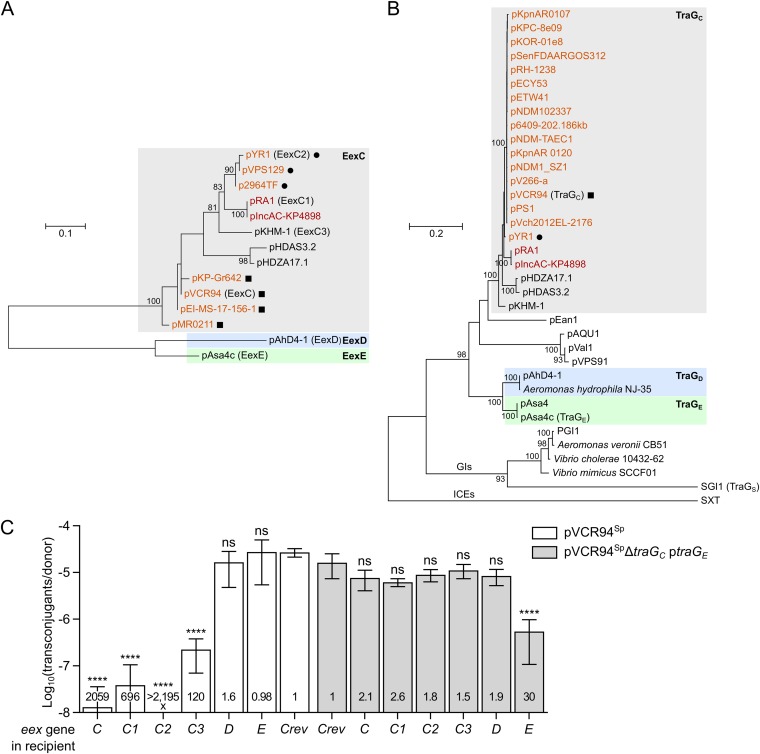
FIG 3.
Multiple-entry exclusion groups among IncC-related conjugative plasmids. (A and B) Maximum likelihood phylogenetic analysis of Eex (A) and TraG (B) homologs. Trees with the highest log likelihoods (−987.74 and −16,264.82 for Eex and TraG, respectively) are shown. Bootstrap supports are indicated as percentages at the branching points only when >80%. Branch length represents the number of substitutions per site over 114 and 1,204 amino acid positions for Eex and TraG proteins, respectively. Only one representative per cluster of identical proteins is shown in each tree (Data Sets S1 and S2). IncC and IncA plasmids are shown in orange and red, respectively. Circles and squares indicate plasmids coding for identical TraG proteins. GIs indicates a lineage of TraG proteins encoded by SGI1-like genomic islands. TraG of the ICE SXT (TraG/EexS exclusion system) was used as the outgroup. (C) Experimental confirmation of exclusion groups. Mating assays were performed using as donor strains GG56 bearing either pVCR94Sp or its ΔtraGC mutant with ptraGE. Recipient strains were CAG18439 strains expressing the different putative eex genes or carrying peexCrev used as the nonexclusion control. Each bar represents the mean of results from three independent experiments, with error bars indicating the standard deviations. Exclusion indexes (EI) are indicated at the bottom of each bar. One-way ANOVAs with Dunnett's multiple-comparison test were carried out on the logarithm of the values to compare each bar to the nonexclusion control for each donor. ****, P < 0.0001; ns, not significant.

