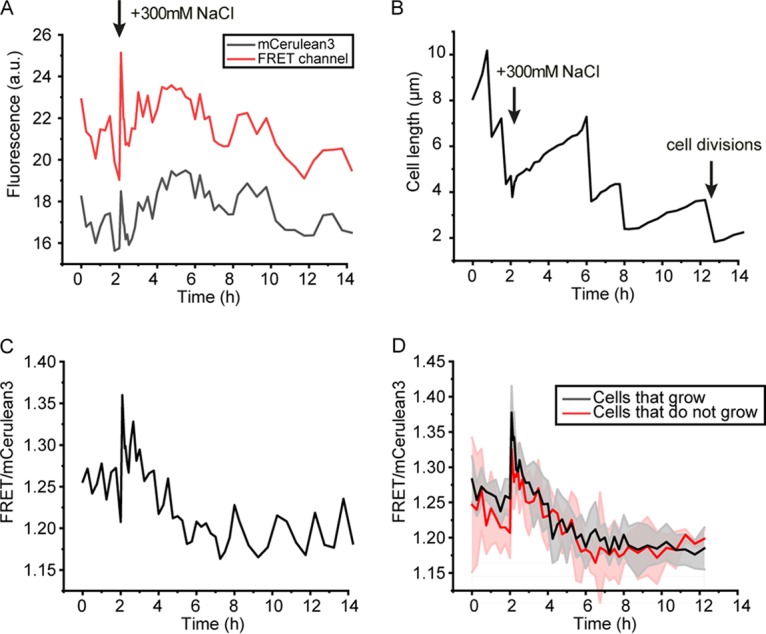
FIG 2.

Single-cell analysis in microfluidics, monitored by confocal microscopy. At 2 h, the medium flown into the chamber that holds the cells was changed from 0.1× MOPS plus 160 mM NaCl to 0.1× MOPS plus 460 mM NaCl (net increase, 300 mM NaCl). The E. coli BL21(DE3) cells contained the crE6G2 sensor in pRSET A. (A) Fluorescence intensity of a single cell over time; the emissions from the mCerulean3 and the FRET channel are shown. (B) Cell length of the same cell analyzed in panel A, showing elongation and cell division and a small transient decrease in cell length following the osmotic upshift at 2 h. The time between cell divisions varies significantly. (C) The FRET/mCerulean3 ratio of the same cell, showing a qualitatively similar time course of the crowding as in the batch experiments. (D) Average of the population of cells that grow after osmotic upshift (n = 9) compared with cells that do not grow (n = 4). Shaded areas are the corresponding standard deviations.
