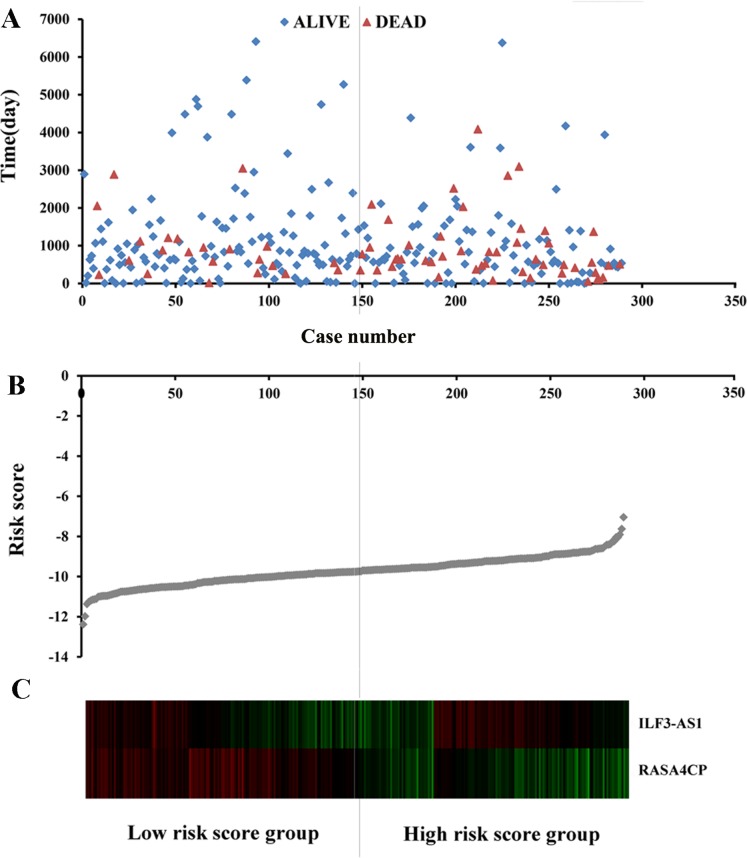
Figure 2. Risk score analysis of the differentially expressed lncRNA signature of cervical cancer.
(A) Survival status and duration of cases. (B) Risk score of lncRNA signature; (C) Heatmap displaying low- and high-risk score groups for the two lncRNAs. The gray line represents the cut-off values for the high- and low-risk score groups.

