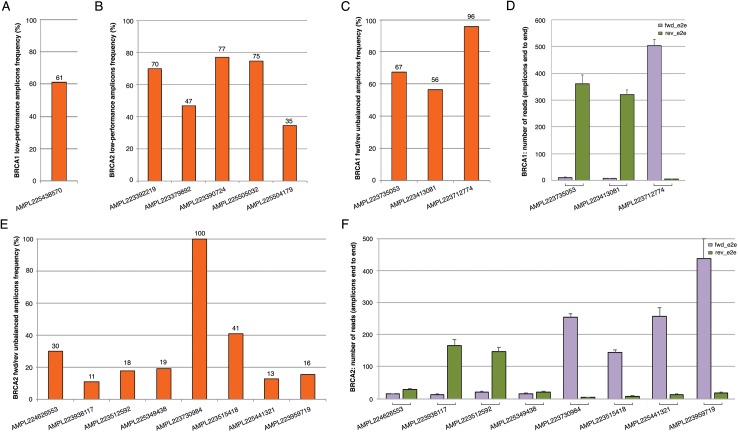
Figure 1. Coverage plots of BRCA1 and BRCA2 lower-performance amplicons from 147 samples (TS and VS samples).
(A, B) BRCA1 and BRCA2 amplicons that did not reach a minimum coverage of 100×; (C, E) percentage of BRCA1 and BRCA2 fwd/rev unbalanced amplicons (minimum average depth in strand bias of 30× for each strand end to end); (D, F) histogram of the mean read depth per fwd/rev end to end unbalanced amplicons in BRCA1 and BRCA2. Error bars represent +/- the standard error (SE) of reads number.

