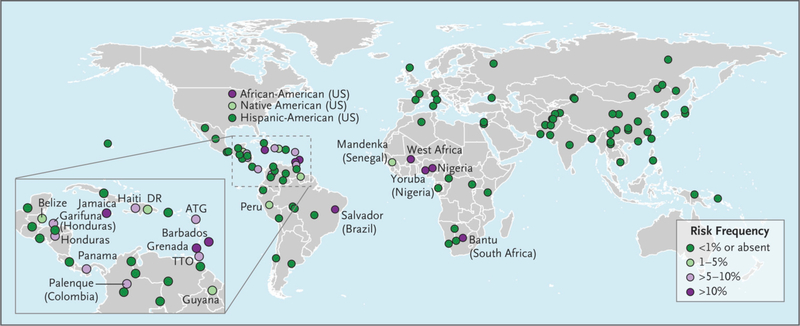
Figure 1.
APOL1 G1/G2 risk in 111 global populations.
We inferred risk-allele status using the two G1 alleles (rs60910145 and rs73885319) and the proxy single-nucleotide polymorphism commonly typed for G2 (rs12106505) on APOL1. Only populations with a risk allele status of 1% or higher are labeled (with the exception of Hispanic Americans). Where possible, precise geographic region or ethnic group labels are used on the map; otherwise, populations are labeled according to country or general geographic region. A more detailed map is available at http://APOL1.org. ATG denotes Antigua, DR Dominican Republic, and TTO Trinidad and Tobago.

