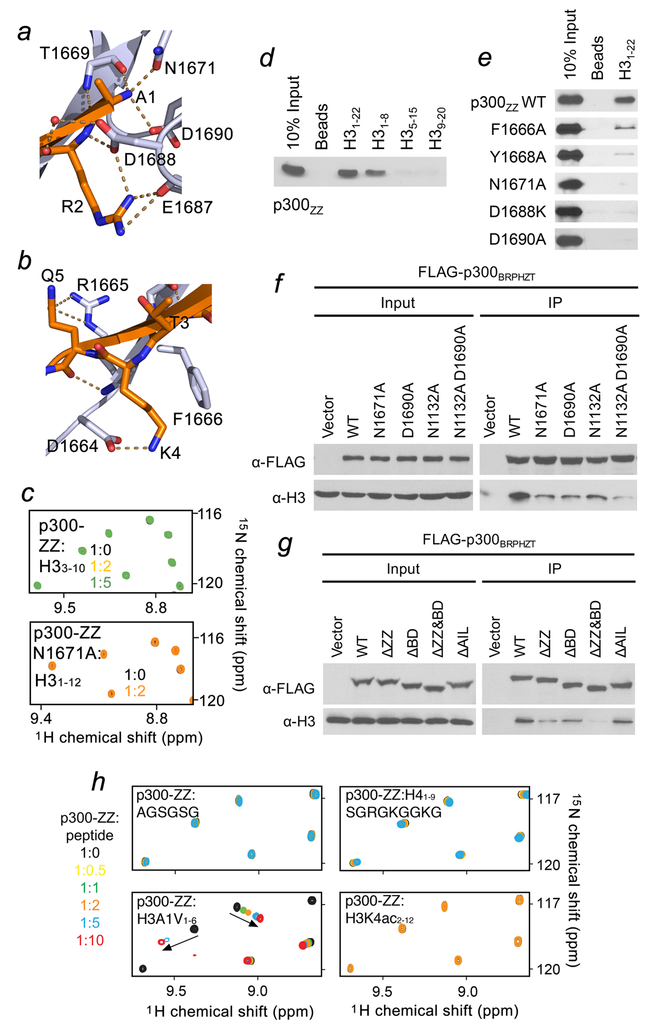
Figure 2. Molecular basis for the recognition of H3 tail by p300-ZZ.
(a) Zoom-in view of the histone H3 Ala1 binding site. (b) Zoom-in view of the histone H3 Lys4 binding site. (c) Superimposed 1H,15N HSQC spectra of p300-ZZ (wild type and N1671A mutant) collected upon titration with indicated H3 peptides. Spectra are color coded according to the protein-to-peptide molar ratio. (d) Peptide pull-down assays for p300-ZZ using indicated histone H3 peptides. (e) Peptide pull-down assays using wild type and mutated p300-ZZ. (f, g) Western blot analysis of chromatin immunoprecipitation (ChIP) of wild type FLAG-p300BRPHZT and indicated point- and deletion-mutants in H1299 stable cells. (h) Superimposed 1H,15N HSQC spectra of p300 ZZ collected upon titration with indicated peptides. Spectra are color coded according to the protein:peptide molar ratio shown on the left. Uncropped blot images (d-g) are shown in Supplementary Data Set 1.

