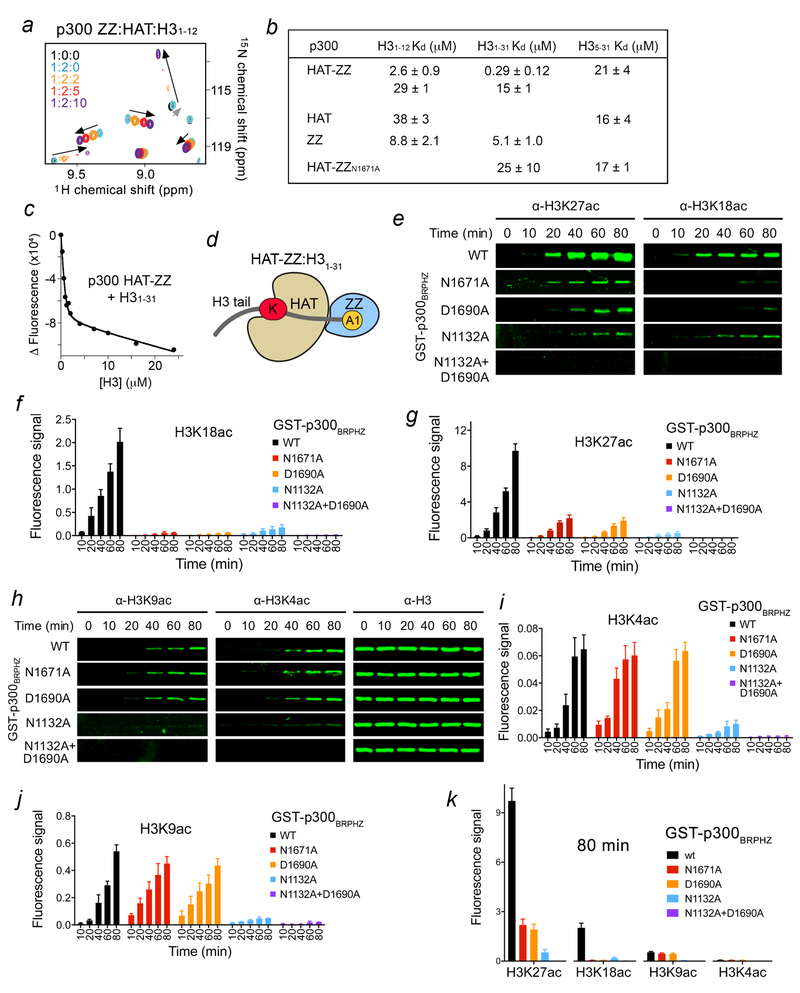
Figure 3. ZZ binding to H3 facilitates HAT activity on the distal lysine residues in H3 tail.
(a) Superimposed 1H,15N HSQC spectra of p300 ZZ collected upon titration with the unlabeled HAT domain (1:2 molar ratio) first and then with H3 peptide. Spectra are color coded according to the protein:ligands molar ratio. (b) Binding affinities of the HAT domain, the ZZ domain and HAT-ZZ of p300 for the indicated histone peptides as measured by tryptophan fluorescence. Kds were calculated from triplicate measurements with the exception of H31–31/ZZ (duplicate). (c) Representative binding curve used to determine the Kd values by fluorescence. See also Supplementary Fig. 2. (d) Cartoon representation of HAT-ZZ in complex with H31–31. (e) in vitro HAT assays using WT and mutated p300BRPHZ and the reconstituted nucleosome. (f, g) Quantification of the HAT activity on H3K18 and H3K27 based on the fluorescence signal in (e) from three biological replicates. A common standard sample is used for normalization in each replicate. (h) H3K9ac, H3K4ac and H3 western blot analysis of in vitro HAT assays using WT and mutated p300BRPHZ and the reconstituted nucleosome. (i, j) Quantification of the HAT activity on H3K4 and H3K9 based on the fluorescence signal from three biological replicates as in (h). A common standard sample is used for normalization in each replicate. (k) Comparison of the fluorescence signal for the indicated histone acetylation marks at 80 min of in vitro HAT reaction. Error bars in (f, g, i-k) represent s.e.m. from 3 independent HAT assays using different batches of enzymes (n = 3 biological replicates). Uncropped blot images (e, h) are shown in Supplementary Data Set 1.

