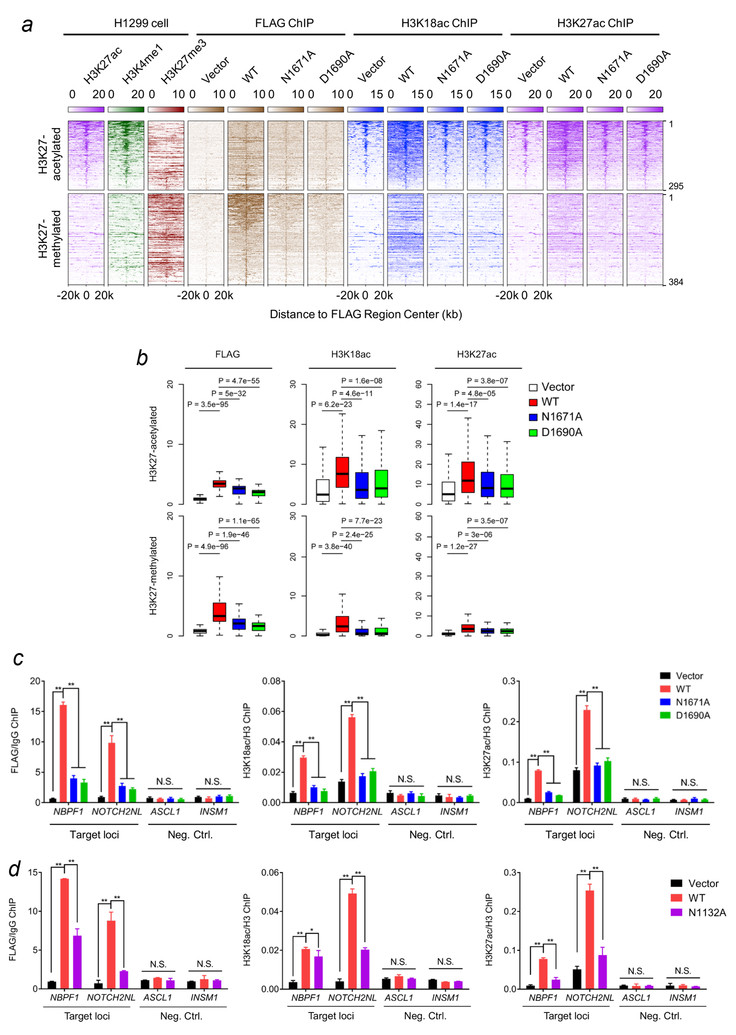
Figure 6. ZZ is required for binding of p300 to chromatin and its acetylation activity on H3K18 and H3K27 in cells.
(a) Heatmap of normalized H3K27ac (purple), H3K4me1 (green), H3K27me3 (scarlet), FLAG (brown) and H3K18ac (blue) ChIP-seq signals centered on FLAG binding sites in a ±20kb window in H1299 control cells and H1299 cells stably expressing wild type FLAG-p300BRPHZT or the indicated ZZ mutants. The color keys represent signal density. The peaks are divided into two groups (H3K27 acetylated or H3K27 methylated) based on the pre-existing H3K27 modifications at the peak center. (b) Box plots compare FLAG, H3K18ac and H3K27ac occupancies in different samples at FLAG binding peaks. All FLAG peaks are divided into two groups as in (a). The center line of box represents the median and box limits indicate the 25th and 75th percentiles. Two-tailed paired Student’s t-test was used for statistical analyses. (c) qPCR analysis of the FLAG-p300BRPHZT, H3K18ac and H3K27ac ChIP at target loci (locations indicated by black line in Supplementary Fig. 7c) and two negative control loci in H1299 cells stably expressing wild type FLAG-p300BRPHZT or the indicated mutants. IgG or H3 ChIP was used for normalization. (d) qPCR analysis of the FLAG-p300BRPHZT, H3K18ac and H3K27ac ChIP at target loci and two negative control loci in H1299 cells stably expressing wild type FLAG-p300BRPHZT or the N1132A BD mutant. IgG or H3 ChIP was used for normalization. Error bars in (c, d) represent s.e.m. from 3 individual experiments (n = 3 experimental repeats).

