Figure 1.

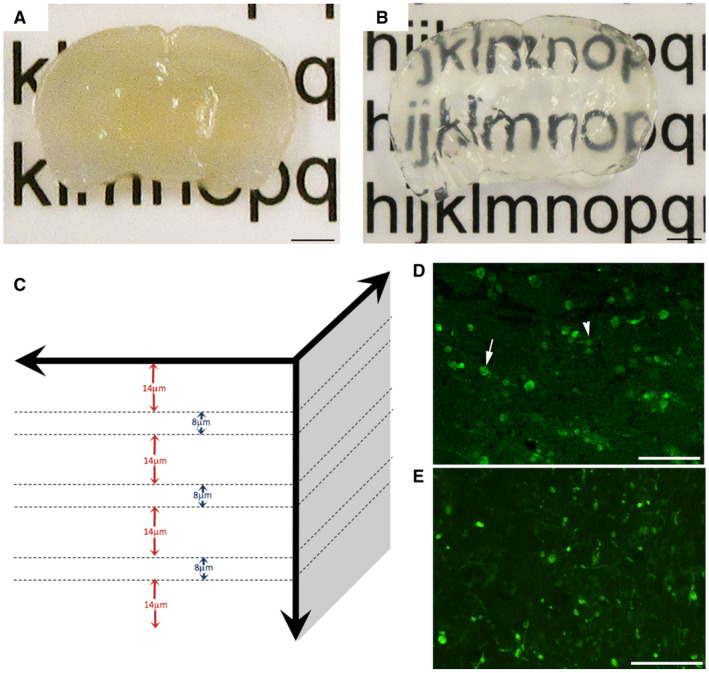
Evaluation of axonal pathology using the CLARITY technique. Representative example of 2‐mm‐thick block of uninjured mouse brain sectioned in the coronal plane (A) before and (B) after tissue clearing. (C) Diagram demonstrating the approach to analysis of cleared tissue. Specifically, 8‐µm regions of tissue were flattened (maximum‐projection function) to simulate traditional formalin‐fixed paraffin‐embedded (FFPE) tissue sections. Bulbs identified within these regions were re‐evaluated with the full 3D of tissue up to 100 µm to determine their true morphology and connectivity status. Fourteen micrometer gaps were included to avoid measurement of the same bulbs twice (based on maximal bulb size). (D) Representative example of standard 8µm‐thick FFPE mouse tissue section immunofluorescently labeled with APP. Axonal swellings can be observed in the peri‐contusional region at 24 h following CCI. Note, while the vast majority of APP swellings appear as disconnected, terminal axonal bulbs (arrow), occasional varicosities can be observed with two clear projections from a single swelling along an intact axon (arrowhead). (E) APP immunoreactive axonal pathology observed peri‐contusionally at 24 h post‐CCI on 8‐µm‐thick maximum projection images using cleared tissue appears indistinguishable from standard FFPE immunofluorescent sections in (D). Scale bars: (A,B) 2 mm, (D,E) 50 µm.
