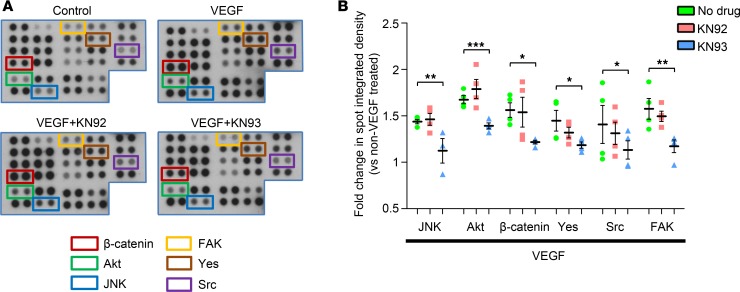
Figure 3. Phospho-proteomic analysis of human retinal microvascular endothelial cells (HRMECs) using the R&D Systems Human Phospho-Kinase array.
HRMECs were treated with VEGF in the presence or absence of the Ca2+/calmodulin-dependent kinase II inhibitor KN93 (10 μM) or its inactive compound KN92 (10 μM) and the phosphorylation level of individual kinases represented on the array compared with untreated (control) cells. (A) Representative images showing a selected region of the phospho-kinase array for control cells and HRMECs exposed to VEGF with or without KN93 or KN92 treatment. Each kinase is spotted in duplicate and the location of JNK, Akt (S473), Yes, Src, FAK, and β-catenin is denoted using colored boxes. (B) Quantitative analysis of the spots was performed by densitometry and presented as fold change vs. control cells. Data represent mean ± SEM. *P < 0.05, **P < 0.01, ***P < 0.001 based on ANOVA; n = 2 biological replicates and 4 technical replicates per group.

