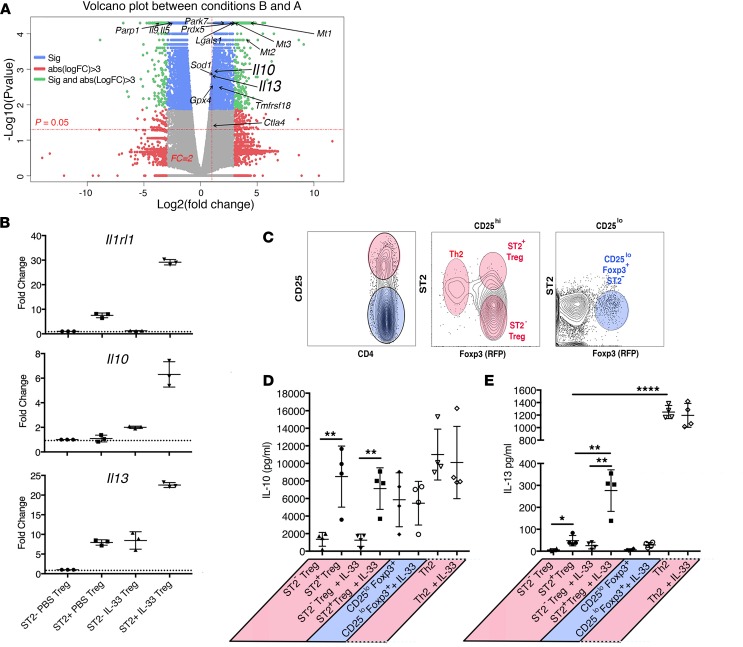
Figure 4. IL-33 stimulates the secretion of IL-13 by murine ST2+ Tregs.
(A) Volcano plot depicting RNA-Seq analysis comparing ST2+ Tregs stimulated for 6 hours in the presence (condition B) or absence of IL-33 (20 ng/ml) (condition A) revealed increased transcripts for Il10 and Il13 after IL-33 stimulation. (B) qRT-PCR for Il1rl1, Il10, and Il13 expressed by sorted CD4+Foxp3+ (RFP+) ST2– or ST2+ cells from PBS- or IL-33–treated Foxp3-IRES-mRFP reporter mice confirmed RNA-Seq findings. Each column represents 3 mice. Data are from 1 experiment representative of 3 completed. (C–E) Representative flow cytometry plot (C) depicting the sorting strategy used for assessment of cytokine secretion by indicated CD4+ T cell populations after culture with or without IL-33 (20 ng/ml). Supernatants were harvested on day 3 of culture and assessed by Cytometric Bead Array (CBA) for (D) IL-10 and (E) IL-13. Statistical analysis with ANOVA was used to establish significance between values indicated. *P < 0.05; **P < 0.01; ****P < 0.0001.

