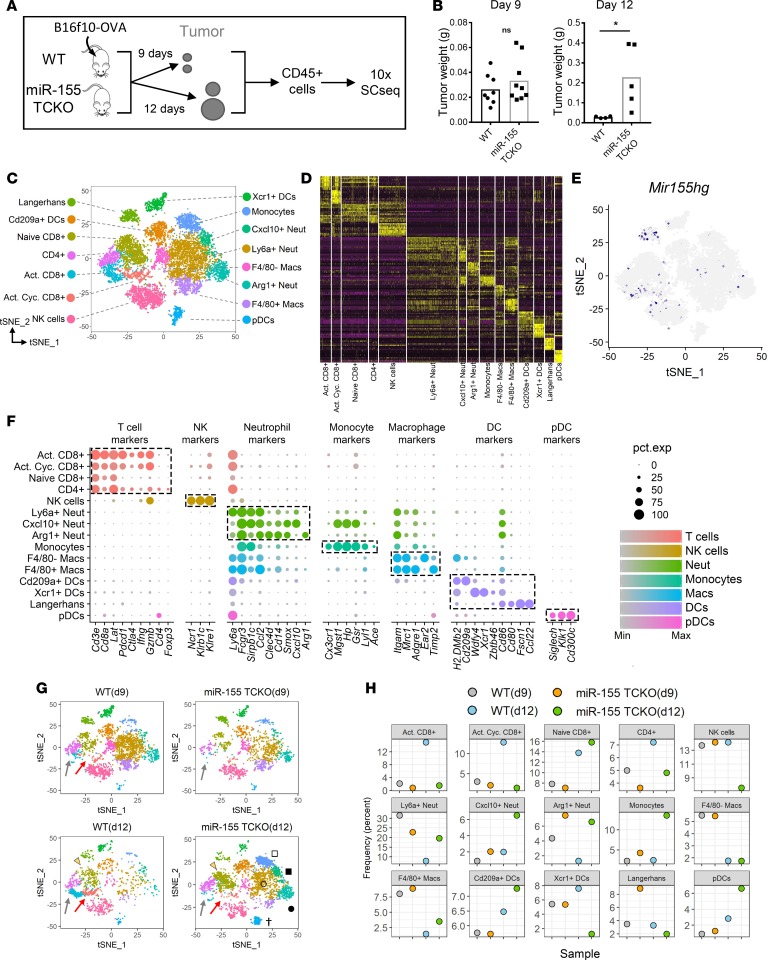
Figure 1. Single-cell RNA sequencing reveals cellular dynamics within the tumor immune microenvironment in the presence and absence of T cell–specific miR-155.
(A) Diagram showing the method employed for tumor-infiltrating immune cell single-cell RNA sequencing (SCseq). At the experimental endpoint, cells from 4 mice per group were combined and equal numbers were processed for 10× SCseq. (B) Tumor weights at the experimental endpoints of days 9 and 12, showing a higher tumor burden in miR-155 TCKO mice on day 12. Two-tailed t test was used for statistical comparisons. *P ≤ 0.05; ns, P > 0.05. (C) T-distributed stochastic neighbor embedding (t-SNE) plots of SCseq data showing 15 distinct cell clusters (aggregate data from WT and miR-155 TCKO samples from days 9 and 12). (D) Gene expression heatmap showing the top 10 differentially expressed genes in clusters. Columns indicate clusters and rows indicate genes. The column widths are proportional to the numbers of cells in clusters. Each vertical bar within the columns represents an individual cell. (E) Expression pattern of miR-155 host gene (Mir155hg) is shown. (F) Dot charts showing the expression of selected genes in cell clusters. The size of the dots represents the frequency of cells within the cluster expressing the gene of interest, while the color intensity indicates the level of expression. Dashed boxes indicate genes that are selectively expressed within clusters. (G) SCseq t-SNE plots showing the immune landscape in WT and miR-155 TCKO animals at 2 different time points. Activated CD8+ T cell (gray arrows), activated cycling CD8+ T cell (red arrows), naive CD8+ T cell (yellow arrowhead), pDC (dagger), Ly6a+ neutrophil (unfilled circle), Arg1+ neutrophil (filled circle), monocyte (unfilled square), and F4/80– macrophage (filled square) clusters are indicated. (H) Frequency of cell clusters in WT and miR-155 TCKO tumor microenvironment at days 9 and 12.

