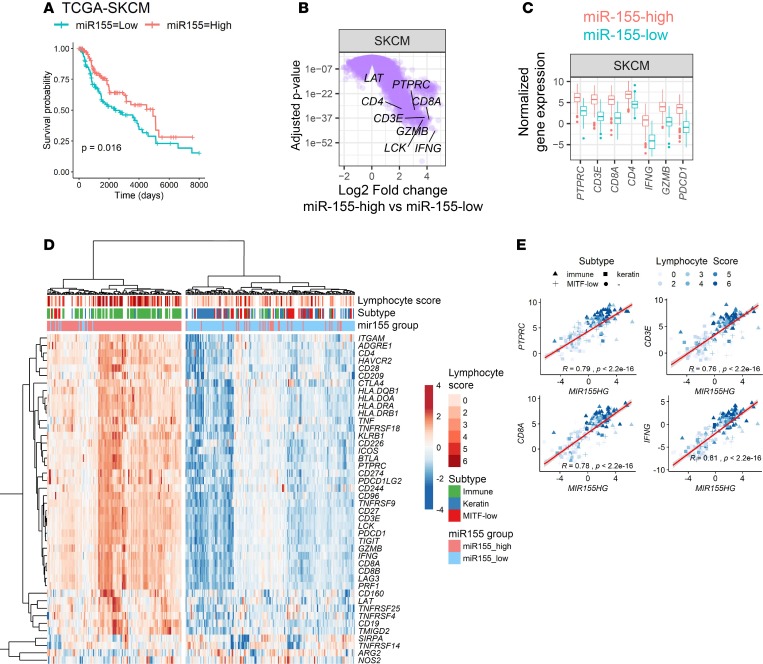
Figure 4. miR-155 expression defines an immune-enriched phenotype in human cutaneous melanoma.
(A) Kaplan-Meier survival curves showing an improved clinical outcome in miR-155–high subpopulation of skin cutaneous melanoma (SKCM) patients (red line). For this analysis, miRseq data from The Cancer Genome Atlas (TCGA) was categorized at the top and bottom thirds, resulting in 148 patients per group. P value of the log-rank test is shown in the graph. (B) Volcano plots showing differentially expressed genes in miR-155–high SKCM subpopulation. This plot was generated by analyzing RNAseq data from the same patients categorized in panel A. T cell–associated genes are indicated, showing a significant upregulation in the miR-155–high cohort. A linear fit model was used and the P values were corrected using the Benjamini-Hochberg method. (C) Comparison of the T cell–associated gene expression between miR-155–high and miR-155–low SKCM subpopulations. (D) Heatmap showing the correlation between miR-155 expression and SKCM clinical subtype and lymphocyte infiltration scores. Lymphocyte score and tumor subtype for SKCM were defined in a study from TCGA consortium (29). Several immune-related genes showed higher levels of expression in the miR-155–high SKCM subset. Hierarchical clustering was performed by using Euclidean distances and the ward.D2 algorithm. (E) Scatter plots showing the positive correlation between miR-155 host gene (MIR155HG) and immune-associated gene expression in TCGA-SKCM. Color gradient indicates the lymphocyte infiltration score of tumors, and the symbol shape indicates the molecular subtype of tumors (▲ immune, ■ keratin, + MITF-low, ● uncategorized). Student’s t test was used for the statistical analysis of the slope of regression line.

