Abstract
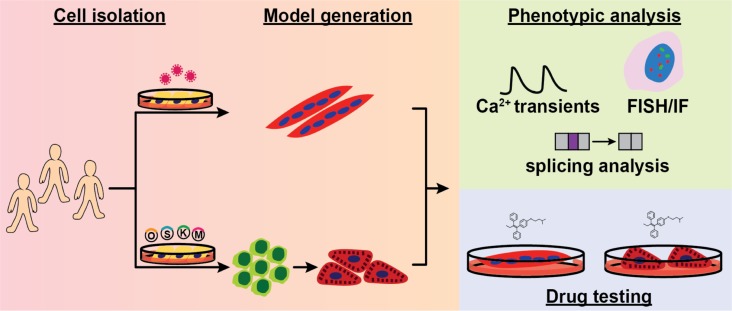
Myotonic dystrophy (DM) is the most common autosomal dominant muscular dystrophy and encompasses both skeletal muscle and cardiac complications. DM is nucleotide repeat expansion disorder in which type 1 (DM1) is due to a trinucleotide repeat expansion on chromosome 19 and type 2 (DM2) arises from a tetranucleotide repeat expansion on chromosome 3. Developing representative models of DM in animals has been challenging due to instability of nucleotide repeat expansions, especially for DM2, which is characterized by nucleotide repeat expansions often greater than 5,000 copies. To investigate mechanisms of human DM, we generated cellular models of DM1 and DM2. We used regulated MyoD expression to reprogram urine-derived cells into myotubes. In this myogenic cell model, we found impaired dystrophin expression, in the presence of muscleblind-like 1 (MBNL1) foci, and aberrant splicing in DM1 but not in DM2 cells. We generated induced pluripotent stem cells (iPSC) from healthy controls and DM1 and DM2 subjects, and we differentiated these into cardiomyocytes. DM1 and DM2 cells displayed an increase in RNA foci concomitant with cellular differentiation. iPSC-derived cardiomyocytes from DM1 but not DM2 had aberrant splicing of known target genes and MBNL sequestration. High-resolution imaging revealed tight association between MBNL clusters and RNA foci in DM1. Ca2+ transients differed between DM1- and DM2 iPSC–derived cardiomyocytes, and each differed from healthy control cells. RNA-sequencing from DM1- and DM2 iPSC–derived cardiomyocytes revealed distinct misregulation of gene expression, as well as differential aberrant splicing patterns. Together, these data support that DM1 and DM2, despite some shared clinical and molecular features, have distinct pathological signatures.
Keywords: Cardiology, Stem cells
Keywords: Genetic variation, Muscle, iPS cells
Using human cell models, abnormal splicing and splicing factor sequestration were found to characterize Myotonic Dystrophy type 1 but not type 2.
Introduction
Myotonic dystrophies (DMs) are autosomal dominant nucleotide repeat expansion disorders with skeletal muscle myotonia and weakness, as well as cardiac arrhythmias and heart failure (1–3). Type 1 (DM1) is caused by a CTG trinucleotide expansion in 3′ untranslated region of DMPK gene (4–6), while type 2 (DM2) arises from a CCTG tetranucleotide expansion in intron 1 of the CNBP (previously known as the ZNF9) gene (7, 8). In DM1, there is a correlation between number of repeats and disease age of onset. Those with 50–1,000 repeats typically have adult-onset DM1, with a range of clinical features, and those with greater than 1,000 repeats will often have early-onset congenital DM1 that displays many more systemic and profound clinical features (3, 9). DM2 is characterized by an average repeat length of 5,000 (8) and no reliable correlation between the number of repeats and disease onset (9, 10). DM2 is considered an adult-onset condition without an early-onset congenital form, which occurs in DM1 (10).
The main mechanism thought to underlie DM is toxic RNA gain of function. RNA expression of nucleotide repeat expansions has been linked to the presence of RNA aggregates detected in nuclei as ribonuclear foci (11, 12). Furthermore, these foci sequester splicing factors, such as muscleblind-like 1 (MBNL1) (12–15). Sequestration of MBNL1 and functional depletion of the protein have been linked to missplicing of downstream genes such as INSR and CLCN1, which are thought to explain both insulin resistance and muscle myotonia in DM1, respectively (16–18). In addition to MBNL sequestration, upregulation of RNA binding proteins like CUGBP1 has also been described, suggesting that multiple RNA regulatory proteins are implicated in DM pathogenesis (19). To date, most studies have been focused on DM1 rather than DM2, in part because features of myotonia are more prevalent in DM1 and the frequency of DM1 is generally thought to exceed that of DM2 (3). More recent studies suggest that DM2 may be more prevalent than previously appreciated in specific populations (20). Although DM1 and DM2 share the common theme of nucleotide repeat expansion and some clinical features, there are key clinical differences. Notably, DM2 typically has a later age of onset despite having a significantly larger nucleotide repeat expansion (2). There is considerable overlap among the clinical findings in DM1 and DM2 with progressive skeletal muscle weakness and cardiac complications (21–24). Cardiac conduction defects and arrhythmias can occur in both DM1 and DM2 (10, 23, 25). Missplicing of cardiac troponin T, TNNT2, has been implicated in cardiac dysfunction in DM (26). Missplicing of SCN5A, which encodes the major sodium channel in the heart, was linked to DM arrhythmogenesis (27).
Generating animal models of DM has been hindered by the instability of nucleotide repeat expansions, especially for DM2 with its very large tetranucleotide repeat expansion. The Mbnl1Δ3/Δ3 model recapitulates MBNL1 depletion, while expression of CTG repeats in a tissue specific or even conditional format recapitulates myotonia, weakness, and, in some cases, cardiac dysfunction (19, 28–30). To study DM pathogenesis in the context of human cells, we now established human DM models using 2 distinct approaches to investigate both skeletal and cardiac muscle phenotypes. We generated a skeletal muscle–like model using inducible MyoD in urine-derived cells. These data confirm previously described features of DM1 but suggest that DM2 occurs by alternative pathological mechanisms. We generated induced pluripotent stem cells (iPSCs) from DM1 and DM2 patients and differentiated these into cardiomyocytes (iPSC-CMs). We found that DM1 myotubes and iPSC-CMs readily displayed intranuclear MBNL1 clusters, while DM2 myotubes showed very few, if any, MBNL1 clusters in both skeletal muscle and cardiac models. Correspondingly, DM1 skeletal muscle and cardiac models recapitulated known pathogenic alternative splicing patterns, whereas DM2 cells had differing patterns. DM1 and DM2 iPSC-CMs exhibited distinct calcium-handling defects compared with controls cells, potentially accounting for cardiac complications in these disorders. RNA sequencing (RNA-seq) of DM1 and DM2 iPSC-CMs identified aberrant splicing and gene expression profiles, underscoring unique pathogenic mechanisms in DM1 and DM2.
Results
Myotube differentiation of DM1 and DM2 urine-derived cells.
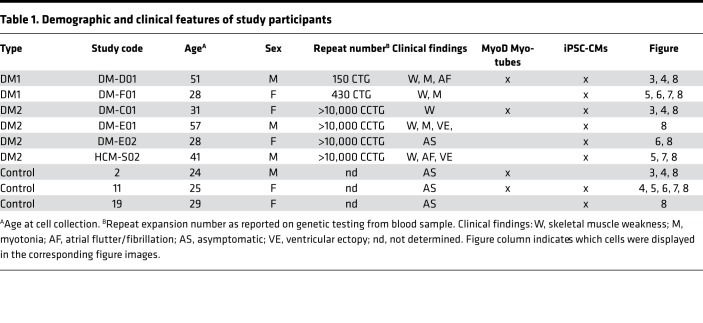
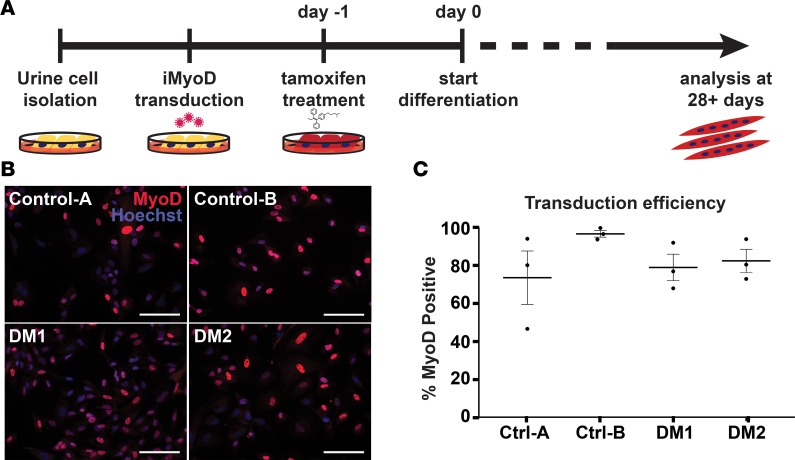
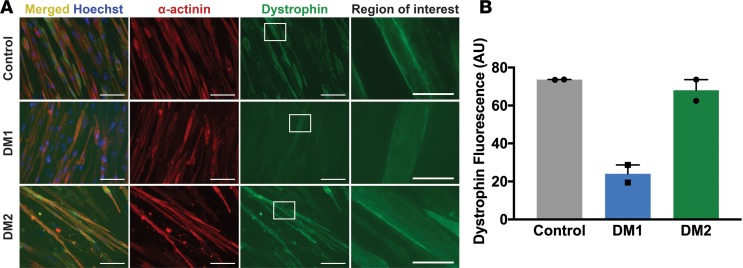
Urine-derived cells were directly reprogramed into myotubes using MyoD (31). This system relies on delivery of a lentiviral construct expressing an inducible MyoD (iMyoD) that is expressed when tamoxifen is present (32). Urine-derived cells were isolated and cultured from DM1, DM2, and healthy controls and then transduced with iMyoD lentivirus. The clinical features and ages of the participating subjects is shown in Table 1. Following induction of MyoD with tamoxifen, cells acquired a myotube-like appearance (Figure 1A). Immunostaining using an anti-MyoD antibody demonstrated intranuclear localization of MyoD after tamoxifen treatment (Figure 1B). Transduction efficiency typically exceeded 70% at the initiation of differentiation and was comparable among DM1, DM2, and healthy controls (Figure 1C). At 28 days after differentiation, myotubes were seen in control, DM1, and DM2 lines (Figure 2), and α-actinin — a marker of muscle differentiation — was readily detected and appeared similar in the expected sarcomeric pattern in all lines (Figure 2). Immunostaining with anti-dystrophin, a marker of mature muscle membrane, reproducibly showed diminished sarcolemma localization in DM1 myotubes compared with control and DM2 myotubes (Figure 2). These data are consistent with prior reports that DM1 myotubes have impaired differentiation (33, 34).
Table 1. Demographic and clinical features of study participants.
Figure 1. Generating human myotonic dystrophy (DM) myogenic cell lines using direct reprogramming of urine-derived cells with the transcription factor MyoD.
(A) Obtaining muscle biopsies requires an invasive muscle biopsy. In contrast, cells from urine can be obtained noninvasively, and following culturing, urine cells can be reprogrammed into cell types of interest (31). Urine cells were cultured from healthy controls and individuals with myotonic dystrophy type 1 (DM1) and DM2. Once cell cultures were established, cells were transduced with lentivirus expressing an inducible form of MyoD (iMyoD) in order to induce myogenic reprogramming. This lentivirus produces MyoD in the presence of tamoxifen. Tamoxifen was used to induce MyoD expression, which, in turn, stimulated multinucleated myotube formation in culture. Directly reprogrammed multinucleated myotubes were studied after 28 days in culture. (B) MyoD (red) protein expression was readily detected in the nucleus of tamoxifen-treated cells. Nuclei were labeled with Hoechst 33342 (blue). Scale bar: 100 μm. (C) With Hoechst costaining, the transduction efficiency of each transduction (example in B) could be estimated. Transduction efficiency with the iMyoD construct was similar among control, DM1, and DM2 cell lines and, in each case, averaged greater than 70%. Efficiencies are represented as percentages of MyoD positive nuclei relative to total number of nuclei.
Figure 2. Myotonic dystrophy type 1 (DM1) myogenic cells have reduced dystrophin expression compared with DM2 and control cells.
Direct reprogramming of urine cells was used to generate myotubes in culture from healthy control, DM1, and DM2 subjects. The clinical features of these human subjects are indicated in Table 1. (A) Myotubes were immunostained with α-actinin (red) and dystrophin (green) to assess myotube formation, sarcomere, and membrane protein content using markers of the Z disc (α-actinin) and the membrane-associated marker dystrophin. Nuclei were labeled with Hoechst (blue). The left column shows elongated myotubes and the merged α-actinin and dystrophin staining. Higher-magnification images of the white dotted box in column 3 are shown in the right column. Scale bar: 100 μm (images in columns 1, 2, and 3). Scale bar: 25 μm (right column). Reduced dystrophin staining was evident in DM1 myotubes. (B) DM1 myotubes had reduced dystrophin fluorescence (arbitrary units, AU) compared with control and DM2 myotubes. The reduced expression of dystrophin is viewed as a sign of impaired differentiation of DM1 myotubes, consistent with previous reports of cultured myoblasts from muscle (33, 34), and it indicates that reprogrammed urine cells can be used to model myotonic dystrophy in culture.
MBNL1 foci and splicing defects in DM1 myotubes.
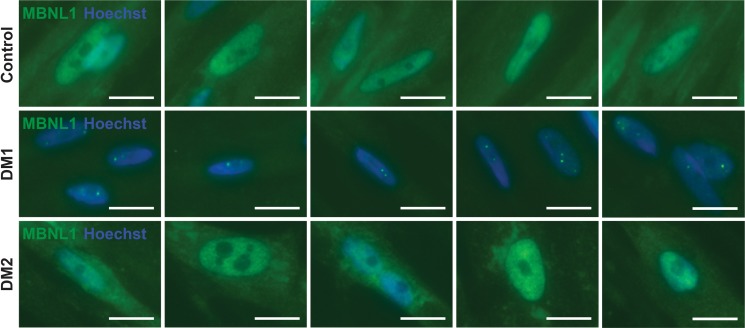
In DM, RNA expression of nucleotide repeat expansions promote missplicing via sequestration of RNA binding splicing regulators such as MBNL1 (12). To determine whether MyoD-reprogrammed urine-derived cells recapitulated this same pattern of MBNL1 sequestration, immunostaining for MBNL1 was performed. DM1 myotubes showed readily evident intranuclear MBNL1-positive foci (Figure 3, DM1 row). This pattern of MBNL1 foci was accompanied by a loss of diffuse MBNL1 nucleoplasmic staining observed in control myotubes (Figure 3, control row). The MBNL pattern in DM2 myotubes appeared similar to control cells (Figure 3, DM2 row). Specifically, both DM2 and control myotubes showed the diffuse nucleoplasmic MBNL1 pattern. In DM2, small isolated intranuclear MBNL1-positive foci were very rarely observed, and these foci were qualitatively smaller and far less evident in DM2 compared with DM1.
Figure 3. Muscleblind-like splicing regulator 1 (MBNL1) form intranuclear foci in Myotonic dystrophy type 1 (DM1) myotubes.
A hallmark of DM1 is the sequestration of the splicing factor MBNL1 into intranuclear protein aggregates (12). In DM1, MBNL1 foci associate with CUG repeat expansions expressed in RNA (12-15). To determine if urine-derived, reprogrammed myotubes reflected this same pattern, myotubes were immunostained with α-MBNL1 antibody (green), and nuclei were labeled with Hoechst (blue). In myogenic cells generated from healthy controls, the normal pattern of intranuclear MBNL1 protein was seen with its distribution throughout the nucleus in a diffuse pattern (control row). In DM1 myotubes, this diffuse MBNL pattern was lost and, instead, readily detectable MBNL1-positive intranuclear foci were apparent (DM1 row, green dots). In DM2 myogenic cells, the MBNL1 pattern resembled control cells with diffuse MBNL1 distribution throughout the nucleus, indicating that MBNL1 sequestration is more associated with DM1 compared with DM2. Scale bar: 2 μm.
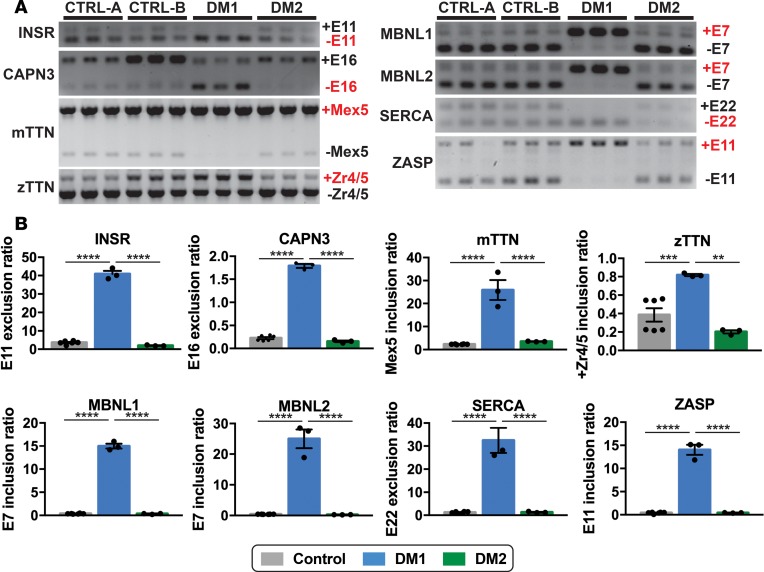
The recruitment of MBNL1 to ribonuclear foci results in a functional depletion of the MBNL1 protein, which is associated with a shifted splicing pattern from adult splice forms to embryonic splice forms (16, 17). Missplicing in DM1 results in both inclusion or exclusion of exons in a cascade of genes (16, 17), including INSR, CAPN3, mTTN, zTTN, MBNL1, MBNL2, SERCA, and ZASP. RT-PCR analysis of these genes in DM1 myotubes displayed the expected increase in embryonic transcripts compared control myotubes (Figure 4, A and B). In contrast, the pattern of splicing in DM2 myotubes was similar to those of control myotubes (Figure 4, A and B). DM1 myotubes showed a statistically significant increase in embryonic transcripts in all 8 genes studied when compared with both control and DM2 myotubes (Figure 4B). These findings suggest that MBNL1-related specific missplicing events characterized DM1 but not DM2 myotubes.
Figure 4. MBNL1-dependent splicing events in DM1 myotubes but not DM2 myotubes.
Myotonic dystrophy is considered a splicing disorder (16, 17). (A and B) RT-PCR was used to monitor specific MBNL-linked splicing events in DM and control myotubes. Splicing events in the following genes are shown: INSR, CAPN3, mTTN, zTTN, MBNL1, MBNL2, SERCA, and ZASP. In each case, an increase in the embryonic transcripts was observed in DM1 myotubes compared with control and DM2 myotubes (****P < 0.0001, ***P = 0.0035, **P = 0.0009, 1-way ANOVA). The full gels are shown in A, and the quantitation of splice forms is shown in B. Each lane in A indicates technical replicate.
DM iPSC-CMs have increased RNA repeat foci.
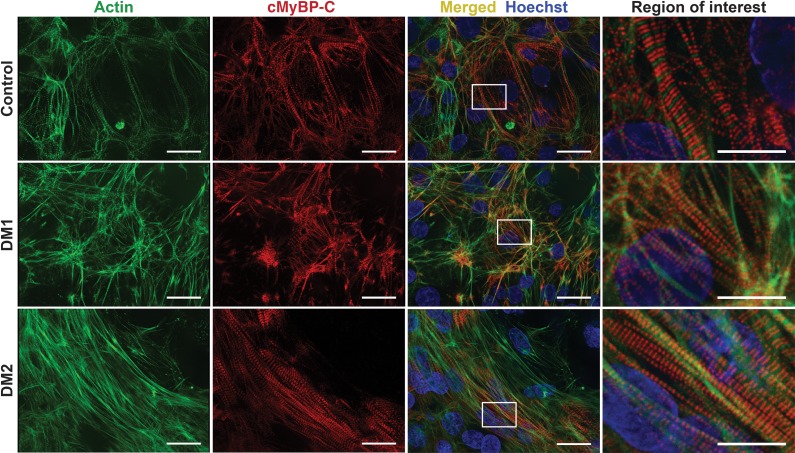
The degree to which MBNL sequestration and missplicing characterizes the myotonic heart has been difficult to monitor, given the scarcity of cardiac tissue from DM patients (35). In order to better understand the pathogenic mechanism of cardiac phenotypes in DM, urine-derived cells were reprogrammed to iPSCs and then differentiated into cardiomyocytes. iPSCs exhibited expression of embryonic stem cell markers such as SSEA4 and Tra-1-60, reflecting pluripotency and successful reprogramming (Supplemental Figure 1; supplemental material available online with this article; https://doi.org/10.1172/jci.insight.122686DS1). iPSC-CMs expressed cardiac-specific myosin binding protein C (cMyBP-C) in a sarcomeric, doublet pattern alternating with actin, indicating cardiomyocyte differentiation in both control and DM cells (Figure 5).
Figure 5. Generation of induced pluripotent stem cells and cardiomyocytes from myotonic dystrophy subjects.
The same urine cells isolated from healthy control, DM1, and DM2 subjects were reprogrammed to induced pluripotent stem cells (iPSCs) using episomal delivery of Yamanaka factors. iPSCs were then differentiated into cardiomyocytes (iPSC-CM). To monitor differentiation status, cells were immunostained with antibodies to actin (green) and cardiac myosin binding protein C (cMyBP-C) (red). Nuclei were labeled with Hoechst (blue). DM1, DM2, and control cells successfully differentiated into iPSC-CMs and the cardiac markers, actin and MYBPC3, demonstrated the expected sarcomeric pattern. Higher-magnification images of the white dotted boxes are shown on the right column. Scale bar: 25 μm (all panels except region of interest). Scale bar: 10 μm (region of interest).
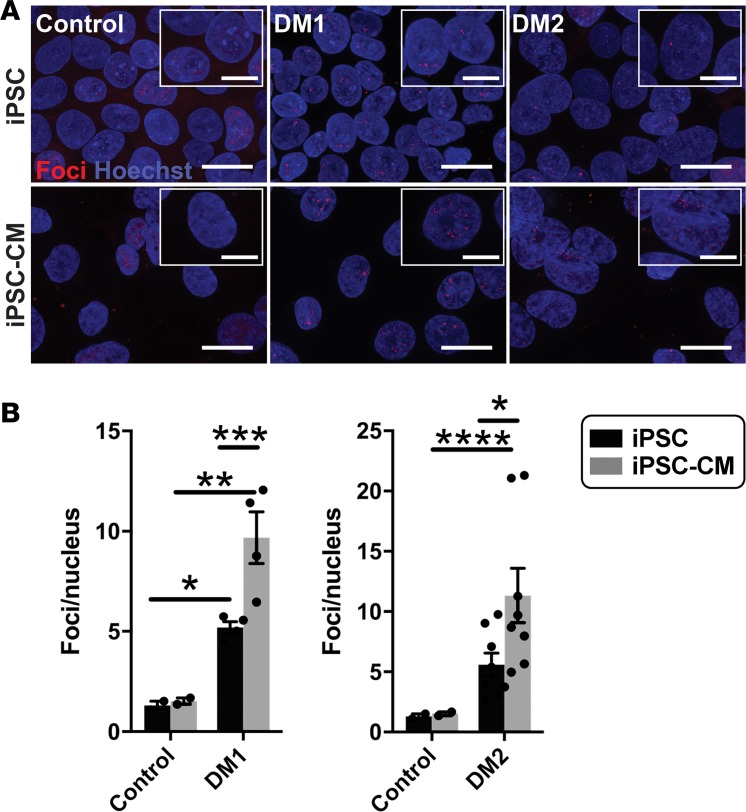
RNA expression of nucleotide repeat expansions was detected as ribonuclear foci using RNA fluorescence in situ hybridization (FISH). We evaluated RNA foci using RNA FISH in iPSCs in the undifferentiated state and iPSC-CMs. RNA FISH using probes specific to repeat expansion regions of DM1 or DM2 demonstrated the formation of intranuclear foci in both DM1 and DM2 undifferentiated iPSCs, as well as differentiated iPSC-CMs (Figure 6A, red foci). Quantitation of RNA foci showed an increased number of intranuclear foci in DM1 as compared with control cells (Figure 6B). DM2 iPSCs had an increased number of RNA foci that trended toward significance (P < 0.07) when compared with control cells (Figure 6B). Differentiation to cardiomyocytes promoted a further increase in foci per nucleus in both DM1 and DM2, indicating that differentiation enhanced the formation of RNA foci (Figure 6B).
Figure 6. Fluorescence in situ hybridization (FISH) detected an increase in RNA foci after cardiomyocyte differentiation.
FISH was used to detect RNA-encoded nucleotide repeat expansions using probes specific to the repeat expansions in DM1 or DM2. RNA probes for FISH included either (CAG)10 to detect DM1 or (CAGG)5 to detect the DM2 repeat expansion. Probes were labeled with Cy3 (red), FISH was conducted, and the number of foci was quantified and compared in undifferentiated iPSCs and iPSCs that had been differentiated to cardiomyocytes (iPSC-CM). (A) Example images of RNA foci (red) visualized using Cy3-labeled probes specific for the myotonic disease subtype. Nuclei were labeled with Hoechst (blue). Magnified images are shown in the insets. Scale bar: 20 μm; 10 μm (inset). (B) DM1 iPSCs and iPSC-CMs had an increased number of RNA foci compared with healthy control cells (*P = 0.04, **P = 0.0008, respectively). DM2 iPSC-CMs had an increased number of RNA foci compared with healthy control cells (****P = 0.03), while iPSC cells trended toward significance when compared with control cells (P < 0.07). For both DM1 and DM2, differentiation of iPSCs into iPSC-CMs resulted in an increase number of RNA repeat foci in iPSC-CMs (***P = 0.008, *P = 0.04, respectively). The number of RNA foci did not change with differentiation in control cells (2-way ANOVA).
Aberrant splicing patterns in DM1 iPSC-CMs.
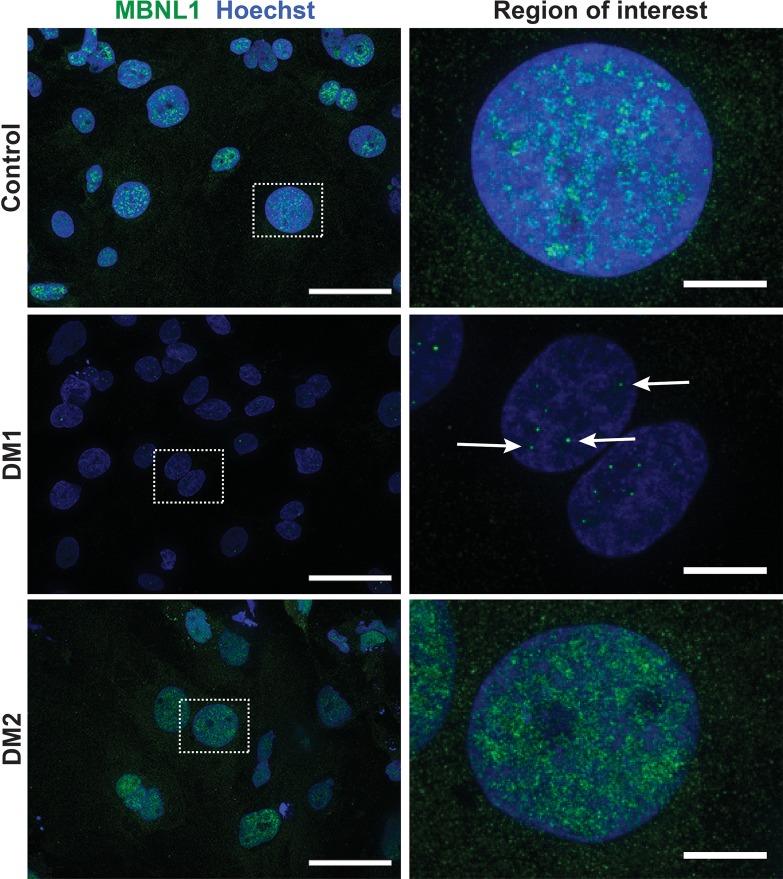
We examined differentiated iPSC-CMs for MBNL1 sequestration and aberrant splicing, as this same mechanism is thought to contribute to pathology in the myotonic heart (35). DM1 iPSC-CMs had abundant MBNL intranuclear foci (Figure 7). In contrast, MBNL1-positive foci were not readily observed in either DM2 or control iPSC-CMs (Figure 7). Moreover, the similar pattern of diffuse nucleoplasmic MBNL1 staining was observed in both control and DM2 iPSC-CMs (Figure 7). Similar to what was observed in the directly reprogrammed myotubes, DM1 cells displayed MBNL1 foci, a molecular signature of DM, while DM2 cells appeared similar to control, suggesting that DM2 pathology is not dependent on MBNL sequestration.
Figure 7. Myotonic dystrophy type 1 iPSC–derived cardiomyocytes are characterized by MBNL foci.
iPSC-derived cardiomyocytes were immunostained with an antibody to the splicing factor MBNL1 (green), and nuclei were labeled with Hoechst (blue). DM1 cardiomyocytes had readily detectable MBNL1-positive intranuclei foci (middle panel, white arrows) and reduced nucleoplasmic MBNL staining compared with control and DM2 cardiomyocytes. These findings support that MBNL1 sequestration characterizes DM1 but not DM2. Higher-magnification images of the white dotted boxes are shown on the right. Scale bar: 50 μm (left); 10 μm (right).
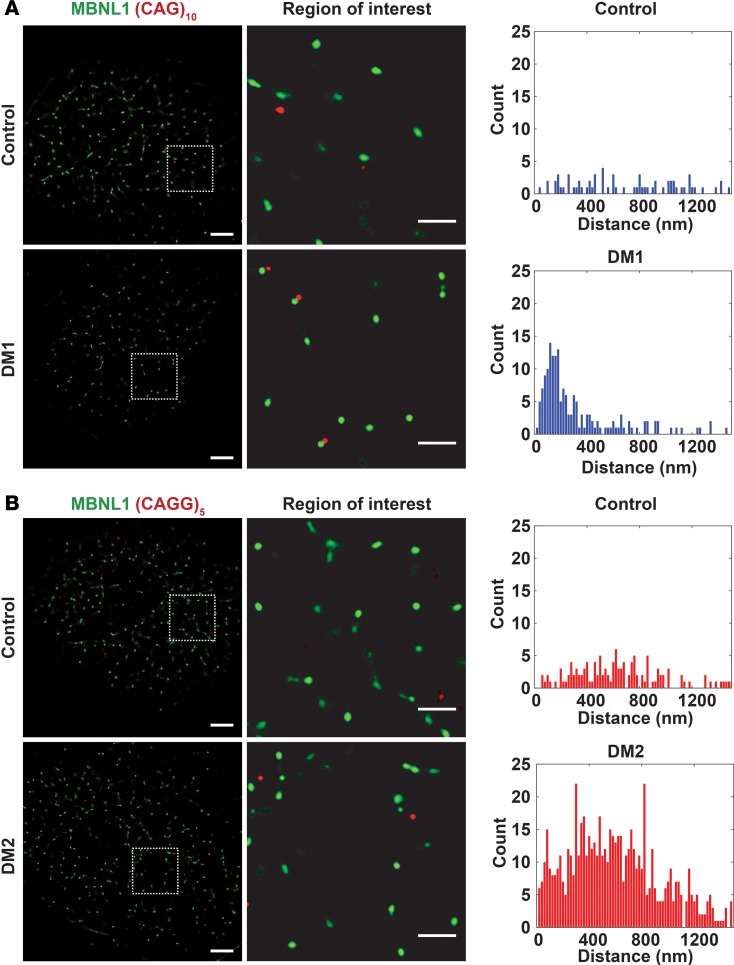
Using high-resolution total internal reflection microscopy, we measured the distance between MBNL1 clusters and RNA FISH foci in DM1 cells (Figure 8A). DM1 cells displayed a peak distance between 120 nm and 200 nm, indicating close colocalization between RNA foci and MBNL1 clusters (Figure 8A). In contrast, the distance between MBNL and RNA foci in control iPSC-CM was consistent with a random distribution and reflected the absence of both MBNL and RNA FISH foci (Figure 8A). In DM2 iPSC-CMs, RNA foci were present, and there was no colocalization between RNA foci and the very rarely observed small MBNL1 foci. This produced a similar random colocalization plot, comparable with that seen in the normal control iPSC-CMs (Figure 8B).
Figure 8. RNA foci tightly colocalized with MBNL1 clusters in DM1 cardiomyocytes.
(A and B) Using probes specific to the RNA repeat expansions, FISH was used to monitor RNA foci and their proximity to MBNL using total internal reflection fluorescence. The cells were colabeled with an antibody to MBNL1 (green). Control iPSC-CMs were labeled with a repeat probe for DM1 (CAG)5 in A and for DM2 (CAGG)10 in B. The distance between RNA foci and MBNL1 foci was quantified. Because MBNL1 foci were only readily detected in DM1 cardiomyocytes, the data from control and DM2 cells represent background signal. Thus, this method was used to measure the distance between RNA repeat expansions and MBNL1 in DM1. (A) RNA foci colocalized with MBNL1 foci in DM1 cardiomyocytes, and the distance between RNA foci and MBNL1 averaged 200 nm, consistent with a very close physical association between RNA repeat expansions and MBNL. Control cardiomyocytes displayed a random distribution of distances (top panel), reflecting the absence of RNA foci and MBNL foci. (B) In DM2 cardiomyocytes, there was no colocalization of RNA foci with MBNL foci, reflecting the absence of MBNL clusters and a pattern similar to cells from healthy controls. Correspondingly, the distances were randomly distributed, similar to control iPSC-CMs (similar distribution between top and bottom panels). Scale bar: 5 μm (left);1 μm (right).
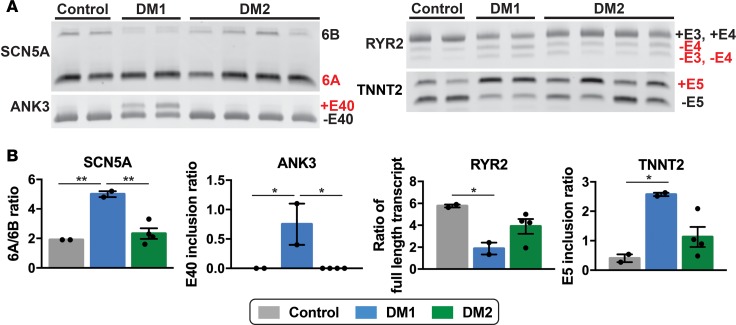
Like skeletal muscle, myotonic hearts are characterized by aberrant splicing. In DM1 hearts, it has been shown that SCN5A transcripts favor inclusion of exon 6A, an embryonically expressed exon, over exon 6B (27). In mice lacking Mbnl1, a model of DM, RYR2 and TNNT2 are alternatively spliced (36). Examination of MBNL1 splicing targets in iPSC-CMs revealed increased inclusion of fetal exons in DM1 cells (Figure 9A). For SCN5A the ratio of exon 6A–6B increased 2.5-fold in DM1 iPSC-CMs compared with controls (Figure 9B). Similarly, in control iPSC-CMs, ANK3 transcripts exhibited minimal exon 40 inclusion, whereas the ratio of transcripts with exon 40 to without exon 40 (+E40/–E40) was significantly increased in DM1 iPSC-CMs (Figure 9B). TNNT2 transcripts also showed a significant increase in transcripts with exon 5 compared with those without exon 5 (+E5/–E5 ratio) in DM1 compared with control cells (Figure 9B). The ratio of full-length transcript with exons 3 and 4 (+E3,4) to transcripts without exon 4 (+E3,4/–E4) in RYR2 decreased 3-fold in DM1 iPSC-CMs (P < 0.05) (Figure 9B). In contrast, DM2 iPSC-CMs showed splicing patterns similar to those of control cells for SCN5A and ANK3 (Figure 9, A and B). The splicing patterns for RYR2 and TNNT2 in DM2 were variable depending on the individual patient (Figure 9A). These findings suggest that MBNL1 sequestration and MBNL-dependent missplicing characterize DM1 but contribute much less to DM2.
Figure 9. RNA splicing profiles distinguish DM1- and DM2 iPSC–derived cardiomyocytes.
(A and B) RNA from iPSC-derived cardiomyocytes was isolated and used for RT-PCR to measure specific splicing events. The SCN5A and ANK3 transcripts revealed an increase in embryonic transcripts from DM1 cardiomyocytes compared with cardiomyocytes from healthy control and DM2 subjects. In DM1, specific splicing events in the RYR2 and TNNT2 transcripts were significantly different from healthy control cardiomyocytes, and variability was observed for DM2 cardiomyocytes. *P < 0.05, 1-way ANOVA. Each lane in A indicates a study subject. **P = 0.006.
A biochemical approach was recently described to identify proteins differentially bound to CCUG compared with CUG oligonucleotides, and this effort identified rbFox proteins as implicated in DM2 (37). The authors demonstrated competitive binding between rbFox proteins and MBNL in DM2 (37). We investigated the expression of rbFox protein in iPSC-CMs finding upregulation of rbFox1 in 1 of 2 DM1 lines and 3 of 4 DM2 lines, suggesting that rbFox may be a variable determinant of cardiac pathogenesis in both DM1 and DM2 (Supplemental Figure 2; see complete unedited blots in the supplemental material).
Altered calcium handing in DM cardiomyocytes.
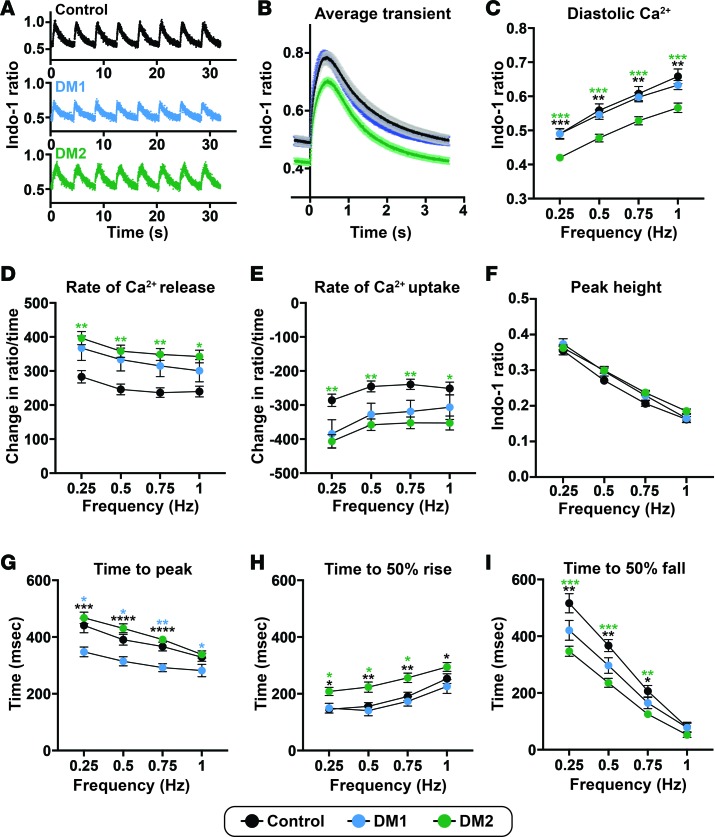
Clinical cardiac complications in both DM1 and DM2 include arrhythmias and heart failure (21, 38). In order to study functional cellular cardiac phenotypes of DM, Ca2+ handling in DM1 and DM2 iPSC-CMs was assessed. iPSC-CMs were loaded with Indo-1, a ratiometric dye that is sensitive to intracellular Ca2+ levels. Cells were paced at 4 different frequencies (0.25, 0.5, 0.75, and 1 Hz), and transients at each frequency were averaged and analyzed (Figure 10, A and B). Diastolic Ca2+ levels were decreased in DM2 iPSC-CMs at every frequency when compared with control and DM1 cells (Figure 10C). Transient peak heights, which measure the difference between peak height and diastolic Ca2+, did not differ among DM and control cells (Figure 10D). At each frequency, rates of Ca2+ release and reuptake were significantly different in DM2 iPSC-CMs compared with control cells (Figure 10, E and F). The time to the peak of the Ca2+ transient was significantly decreased in DM1 cardiomyocytes (Figure 10G). Time to 50% Ca2+ release was increased (Figure 10H), and the time from peak to 50% Ca2+ reuptake was decreased in DM2 iPSC-CMs (Figure 10I). These differences in release and reuptake kinetics between DM1 and DM2 can be seen in the representative Ca2+ transients (Figure 10B). These findings demonstrate distinct calcium-handling profiles for DM1 and DM2, which are distinct from those of controls.
Figure 10. Aberrant but distinct calcium transient patterns in DM1- and DM2 iPSC–derived cardiomyocytes.
iPSC-derived cardiomyocytes were labeled with Indo-1 and paced to monitor Ca2+ shifts within the cells. (A) Representative Ca2+ transient profiles from cardiomyocytes paced at 0.25 Hz derived from healthy control, DM1, and DM2 cardiomyocytes. (B) Average Ca2+ transients (paced at 0.25 Hz) from healthy control, DM1, and DM2 cardiomyocyte cell lines. (C) Diastolic Ca2+ was reduced in DM2 cardiomyocytes. (D) Peak Ca2+ transient amplitude, measured by the difference in peak and diastolic Ca2+, was not different across groups. (E and F) The peak rate of Ca2+ release (E) and the peak rate of Ca2+ reuptake (F) were significantly different in DM2 cardiomyocytes, consistent with altered release and reuptake kinetics compared with healthy control cardiomyocytes. (G–I) Times to peak Ca2+ (G), 50% Ca2+ release (H), and 50% Ca2+ reuptake (I) differed between DM subtypes and healthy control cardiomyocyte cells. Control, 2 cell lines, 33 cell patches; DM1, 2 cell lines, 40 cell patches; DM2, 4 cell lines, 78 cell patches. *P < 0.05, **P < 0.01, ***P < 0.001, ****P < 0.0001, 1-way ANOVA tested at each frequency.
RNA profiling of DM iPSC–derived cardiomyocytes.
RNA-seq was performed on total mRNA isolated from control, DM1, and DM2 iPSC-derived CMs (n = 2 per genotype). After alignment, gene expression was compared pairwise, creating the following 3 groups: control vs. DM1, control vs. DM2, and DM1 vs. DM2. For both DM1 and DM2, more genes were differentially downregulated compared with control than were upregulated (Supplemental Table 1). Of gene categories that were significantly downregulated, genes encoding calcium binding proteins were significantly enriched in DM1 but not DM2 (Supplemental Table 2 and Supplemental Table 3). Downregulation of genes encoding cell matrix proteins was seen for both DM1 and DM2 when each was compared with control. The list of differentially expressed genes is found in Supplemental Table 4.
RNA-seq data was also analyzed for differential RNA splicing events. When considering complete transcripts, 234 transcripts were significantly different in DM1 vs. control, compared with 199 transcripts in DM2 vs. control (Supplemental Table 5).
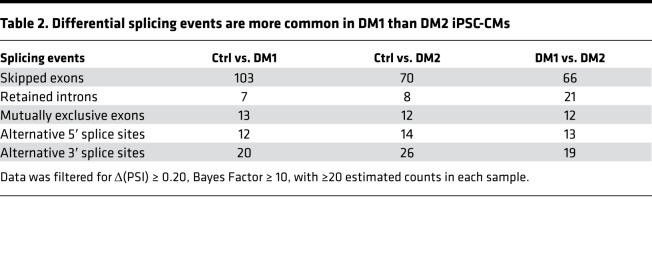
Skipped exon splicing events were the most commonly observed type, with 103 skipped exon events in DM1 iPSC-CMs compared with control and 70 skipped exon events in DM2 iPSC-CMs compared with control (Table 2). There were 66 skipped exon events different between DM1 and DM2 iPSC-CMs. These differences reflect a stringent analysis requiring change in percent spliced in (Δ[PSI]) ≥ 0.20 with ≥20 estimated counts supporting the alternative isoform in each sample. Supplemental Figure 3 highlights differential splicing for ANK3 exon 40, confirming that this event is more enriched in DM1 iPSC-CMs compared with DM2 iPSC-CMs and consistent with RT-PCR data (Figure 9B). The differential downregulation of gene-encoding calcium-binding proteins, along with differential splicing events, may explain the altered calcium handling observed in DM1 and DM2 iPSC-CMs and provides insight on the broad dysregulation that underlies cardiac dysfunction in MD.
Table 2. Differential splicing events are more common in DM1 than DM2 iPSC-CMs.
Discussion
Human myogenic DM cell models support differences previously observed between DM subtypes.
MyoD-directed reprogramming of nonmuscle cells was used to generate human myogenic models of DM. Direct reprogramming by MyoD is an effective means of inducing skeletal muscle-like myogenesis, and the ready access to urine-derived cells makes this an attractive option for human disease modeling (32, 39). MyoD promoted successful myotube generation of both DM1 and DM2 cells, and DM1 myogenic cells recapitulated robust MBNL1 cluster formation and abnormal splicing. DM1 myotubes also had decreased expression of dystrophin when compared with control and DM2 myotubes. Myoblasts isolated from DM1 patients have impaired differentiation attributed to failed MyoD upregulation (34). Notably, overexpression of MyoD was insufficient to overcome these myogenic defects in DM1 myotubes, indicating a more profound developmental defect beyond MyoD expression.
Reprogrammed DM1 myotubes had readily observable MBNL1 clusters, while DM2 myotubes did not. Furthermore, the MBNL-dependent splicing profiles of DM2 myotubes resembled control cells. Skeletal muscle biopsies from DM2 patients have been described as having MBNL1 clusters, but when observed, these biopsies have had many fewer MBNL clusters than DM1 fibers (12, 16, 40). Cardani and colleagues examined serial muscle biopsies from DM2 patients and found that specific splicing events and progression of muscle weakness were not correlated (41). Primary myogenic cell lines from DM2 patients also failed to replicate the missplicing patterns seen in DM1 myogenic lines, including the missplicing of the dystrophin gene (42). Using an array-based exon platform, Perfetti et al. described 273 aberrant splicing events in DM2 muscle compared with control, finding that most of these events were not those previously noted in DM1 (43). Together, these findings — along with newly presented data — support a distinct set of cellular defects, independent of MBNL. MBNL clusters and missplicing events are thought to mediate the hypercontraction of myotonia since overexpression of MBNL can correct myotonia hypercontraction in the mouse (44). This correlates with clinical observations in which myotonia hypercontraction symptoms are less evident in human DM2 patients compared with DM1 patients (3).
Modeling heart disease in DM.
Although iPSC-derived cardiomyocytes are immature in nature, they are useful for modeling human cardiomyopathies (45–47). Both DM1 and DM2 iPSC-CMs demonstrated RNA FISH foci, confirming that these cells carried the molecular defect responsible for DM. The presence of clear MBNL1 clusters in DM1 iPSC-CMs, but not in DM2, indicates alternative downstream consequences of these 2 distinct repeat expansions. The absence of MBNL sequestration in DM2 iPSC-CMs is not a reflection of a lost disease phenotype, since RNA FISH foci were readily apparent in DM1 and DM2 cells but not in controls. Cardiac complications are common in both DM1 and DM2 (25, 38, 48). Using iPSC-CMs, we identified abnormal calcium handling in both DM1 and DM2 cells, with each having altered but distinct kinetics compared with control cells. In DM1, cardiac dysfunction been attributed to missplicing of TNNT2, which encodes a structural protein, and SCN5A, a sodium channel important in the initial upstroke of cardiac action potential (26, 27). RNA-seq analysis of iPSC-CMs identified downregulation of calcium-handling protein genes as a feature of DM1 but not DM2. Analysis of RNA-seq splicing events uncovered distinct profiles between DM1 and DM2 iPSC-CMs. We expect that CCUG repeats may sequester different splicing factors. Previous studies showed differential splicing of RYR1, SERCA1, and CACNA1S (Cav1.1), and splicing events were significantly greater DM1 compared with DM2 (49). We did not observe these specific abnormal splicing events in DM iPSC-CMs, but the broad nature of RNA-seq combined with variability between patients and in iPSC-CM modeling may make these signals difficult to observe, especially if they are low-level events.
Alternative mechanisms in DM2.
The absence of readily detectable MBNL sequestration in DM2 cell models suggests that distinct mechanisms may be occurring. Previously, repeat-associated non-ATG (RAN) translation in DM1 has been described as an additional pathogenic stimulus in DM (50). RAN translation occurs in the absence of an ATG-methionine start codon and expresses a polyglutamine protein detectable in the heart of DM1 mouse model, as well as myoblasts (50). More recently, repeat expansion in DM2 was also shown to create 2 sequences of RAN translation proteins, each arising from bidirectional transcription of the repeat region, that deposit in brain sections of DM2 patients (51). Alternatively, a potentially novel CAGG binding protein, hnRNP A1, has been identified and may contribute to DM pathogenesis (51). Most recently, rbFox RNA binding proteins were implicated in a competitive binding model with MBNL (37). We observed variable upregulation of rbFox1 in both DM1 and DM2 iPSC-CMs, hinting at its potential role in both forms of DM. The nature of the CCUG and CUG repeats — especially their secondary structures, which are perturbed by interruptions in repeat expansion sequences — may render this an important mechanism (52, 53).
These human cell models of DM1 and DM2 provide a platform to highlight type-specific molecular signatures for DM. MyoD-transduced DM1 fibroblasts have already been used to test the efficacy of antisense oligonucleotides in reducing ribonuclear foci (54). MBNL is being considered as a target for treating DM1 (55), and the data herein suggest that this target may be less useful for treating DM2. iPSC-CMs have successfully modeled cardiac arrhythmic disorders and serve as a tool for high-throughput and selective drug screening (56).
Methods
Urine-derived cells isolation and culture.
Cells were isolated from urine samples and maintained as described previously (31).
Lentiviral transduction and myotube differentiation.
The tamoxifen-inducible MyoD lentiviral construct (p-Lv-CMV-MyoD-ER[T]), referred to as iMyoD in this paper, was previously described (32) and was provided by the laboratory of Jeffrey Chamberlain (University of Washington, Seattle, Washington, USA; Addgene plasmid 26809). Lentiviral construct was packaged by the Skin Disease Research Center DNA/RNA Delivery Core at Northwestern University. Transduction with iMyoD, transduction efficiency estimations, and myotube differentiation were done as previously described (31).
Reprogramming to iPSCs.
Urine-derived cells were reprogrammed to iPSCs by electroporating 4 plasmids described previously (57). The 3 reprogramming plasmids were pCXLE-hOCT3/4-shp53-F (Addgene plasmid 27077), pCXLE-hSK (Addgene plasmid 27078), and pCXLE-hUL (Addgene plasmid 27080). The fourth plasmid, pCXLE-EGFP (Addgene plasmid 27082) monitored successful electroporation. Plasmids were prepared using EndoFree Maxi Kit (Qiagen, 12362) and resuspended in UltraPure Distilled Water (Thermo Fisher Scientific, 10977-023). One day prior to electroporation, plasmids were precipitated with 0.3 M sodium acetate (MilliporeSigma, S8750) and at least 70% ethanol at –20°C overnight. On the day of electroporation, plasmids were centrifuged at 16,000 g for 10 minutes at 4°C. Supernatant was removed, and plasmids were washed with 70% ethanol twice; they were centrifuged a first time for 2 minutes and a second time for 10 minutes at 16,000 g, 4°C. Plasmid pellets were then dried and resuspended in UltraPure Distilled Water. Plasmids (5 μg of each) were combined to create plasmid cocktail for each electroporation.
For electroporation, cells were washed once in 1× PBS (Thermo Fisher Scientific, 14190-250), counted, and then resuspended in 200 μl of electroporation buffer (Bio-Rad, 1542677). Electroporation used 100,000 cells. Cell suspensions were combined with the plasmid cocktails and then placed in electroporation cuvette with a 0.4-cm gap (Bio-Rad, 1542088). The Gene Pulser Xcell Electroporation System was used (Bio-Rad, 1652660) with the following electrical setting: exponential decay at 300 V, 200 μFD, 100 Ω. After electroporation, cells were plated directly onto 12-well and 6-well plates preplated with primary mouse embryonic fibroblasts (PMEF, MilliporeSigma, PMEF-CF). MEFs were plated 1 day prior to electroporation on wells coated with 0.1% gelatin (MilliporeSigma, ES-006-B). Electroporated cells were placed in WiCell media with 50 μg/ml ascorbic acid on the day of electroporation. Fresh media was added the next day. On the second day, media was replaced with WiCell with 50 μg/ml ascorbic acid (Santa Cruz Biotechnology Inc., sc-228390) and 0.5 mM sodium butyrate (Stemgent, 04-005). Media was switched every other day until colonies appeared. Colonies were picked manually and subsequently expanded on feeder plates until at least passage 5, and they were then adapted to a feeder-free system using plates coated with hES-qualified Matrigel (Corning, 354277) and grown in mTeSR1 (Stemcell Technologies, 05875). WiCell media was composed of DMEM/F-12 50/50 mix (Corning, 10-092-CV) with 20% KnockOut Serum Replacement (Thermo Fisher Scientific, 10828-028), 1% nonessential amino acids (Thermo Fisher Scientific, 11140-050), 1% GlutaMax (Thermo Fisher Scientific, 35050-061), 0.1 mM β-mercaptoethanol (BME, Thermo Fisher Scientific, 21985-023), and 12.5 ng/ml fibroblast growth factor (bFGF, Miltenyi Biotec, 130-093-842).
Cardiomyocyte differentiation and replating.
Reprogrammed iPSCs were differentiated to cardiomyocytes according to previously described protocol (58), with the starting densities between 100,000–320,000 cells/cm2. Differentiated cardiomyocytes were replated 5–7 days after beating was observed to 12 mm No. 1.5 thickness coverslips (Thermo Fisher Scientific, 12-545-81) or a 35-mm dish fitted with No. 1.5 coverslip (MatTek Corporation, P35G-1.5-14-C). Both types of coverslips were coated with hES-qualified Matrigel (Corning, 354277) prior to seeding cardiomyocytes. Cells were placed in PBS for 20 minutes at 37°C and then dissociated with TrypLE Select (Thermo Fisher Scientific, 12563-011) for 15 minutes at 37°C. Cells were then collected and centrifuged at 300 g for 5 minutes. The supernatant was removed and cells were triturated 15–20 times using 1 ml of RPMI 1640 supplemented with 1× B-27 supplement, 40% FBS, and 2 μM thiazovivin. Resuspended cells were then passed through 100-μm strainers (Thermo Fisher Scientific, 08-771-19). Cells were counted and replated at 140,000 cells/cm2 for downstream applications, as specified in following sections. For 35-mm dishes fitted with coverslips, only the coverslips were coated with Matrigel and plated with cardiomyocytes.
Candidate gene splice form analysis.
Differentiated myotubes at day 28 and 35 after differentiation, and iPSC-derived cardiomyocytes were collected for RNA. The cells were washed once with cold PBS. RNA was isolated using TRIzol (Thermo Fisher Scientific, 15596-018) following the manufacturer’s instructions. Glycogen (Thermo Fisher Scientific, AM9510) was added to the isopropanol at 50–100 μg/ml prior to RNA precipitation. The RNA pellets were washed once in 70% ethanol and resuspended in UltraPure Distilled Water. RNA concentration was measured using NanoDrop 2000 (Thermo Fisher Scientific, ND-2000), and up to 1,000 ng of RNA was reverse transcribed using qScript cDNA SuperMix (Quanta Biosciences, 95048-025). cDNA (30–60 ng) was used per PCR reaction, and the products were separated on 1.5% agarose gel with ethidium bromide. For SCN5A analysis, PCR products were digested with BstBI (New England Biolabs, R0519S) at 65°C for 15 minutes as described previously (27). For PCR reactions run on polyacrylamide gels, 8% Novex TBE gels (Thermo Fisher Scientific, EC6215BOX) were used. The gels were stained with ethidium bromide diluted in TBE buffer for 1–2 minutes at room temperature. All gels were visualized and imaged on UVP Transilluminator. All primers were purchased from Integrated DNA Technologies (IDT), and primer sequences used for RT-PCR are listed in Supplemental Table 6. To quantify band densities of differentially spliced transcripts, the gel images were analyzed using Fiji (NIH). Each lane was selected using Select Lane function of Gel analysis tool in Fiji, and then the lanes were plotted. AUC calculated by Fiji were used as band densities. Ratios are reported as band density of embryonic transcript divided by band density of adult transcript.
RNA FISH and quantification.
iPSCs and iPSC-derived cardiomyocytes were plated on coverslips coated with Matrigel. iPSCs were cultured on coverslips until the colonies reached about 70%–80% confluence, and iPSC-derived cardiomyocytes were plated at 140,000 cells/cm2 and cultured until beating was observed. FISH was performed following a protocol described previously with modifications to wash steps (59). Cells were washed once with room temperature PBS and then fixed in 4% paraformaldehyde (Electron Microscopy Sciences, 15710) diluted in PBS at room temperature for 30 minutes. After fixation, cells were quickly washed 3 times with PBS and then permeabilized in prechilled 2% acetone (MilliporeSigma, 34850) in PBS for 5 minutes. Prehybridization was done with 30% formamide (MilliporeSigma, F7503) diluted in 2× saline sodium citrate (SSC) for 10 minutes at room temperature. Hybridization was done in 2× SSC buffer with 30% formamide (MilliporeSigma, F7503), 0.02% BSA (MilliporeSigma, A7906), 66 μg/ml yeast tRNA (Thermo Fisher Scientific, 15401-011), 10% dextran sulfate (MilliporeSigma, D8906), and 2 mM vanadyl ribonucleoside complex (New England Biolabs, S1402S). Fluorescence probes (IDT) were diluted in the hybridization buffer at a final concentration of 2 ng/μl, and cells were incubated with probes overnight at 37°C. The first posthybridization wash was done 3 times, 10 minutes per wash in 2× SSC buffer with 30% formamide at 55°C. This was followed by second posthybridization wash, which was done 3 times, 10 minutes per wash in 2× SSC buffer with 30% formamide at 37°C. iPSC-derived cardiomyocytes were then subjected to immunofluorescence labeling starting from blocking step as described below. SSC buffer (2×) was made by diluting 20× SSC with water. SSC (20×) was made by dissolving 175.3 g NaCl (Thermo Fisher Scientific, BP358-10) and 88.2 g of sodium citrate (MilliporeSigma, W302600) in water to a final concentration of 3M NaCl and 300 mM sodium citrate. SSC (20×) was then autoclaved for sterilization. The RNA probe used to detect repeats in DM1 patient cells was (CAG)10 and in DM2 patient cells was (CAGG)5. Both probes were labeled at 5′ end with Cy3 and were resuspended in UltraPure Distilled Water to stock concentration of 1 μg/μl.
Cells probed with RNA FISH were imaged on Zeiss Axio Observer epifluorescence microscope with Apotome 2. Z-stack images at 0.15–0.25 μm gap between slices were taken from 3 random fields per coverslip. Z-stacks were collapsed using Z project function for maximum intensity in Fiji (NIH). FISH foci were counted using Find Maxima function in Fiji with noise tolerance set to 25. The number of FISH foci was divided by the number of total nuclei in the field to calculate average number of foci per nucleus. The averages were graphed using GraphPad Prism 7 (GraphPad Software).
Immunofluorescence microscopy (IFM).
After 28 days of differentiation, myotubes were quickly washed 3 times with room temperature PBS and then fixed in 4% paraformaldehyde at room temperature for 15 minutes. Cells were quickly washed once with room temperature PBS and then permeabilized in 0.25% Triton-X (MilliporeSigma, T8787) for 20 minutes at room temperature. Cells were then blocked in 10% horse serum 30 minutes to 1 hour at 4°C. Primary antibody incubations were done overnight at 4°C. After primary antibody incubation, myotubes were washed 3 times at room temperature, 10 minutes per wash. The first and third washes were done using PBS, and the second wash was done using 0.1% Triton-X. Secondary antibody incubations were done at room temperature for 1 hour, followed by 3 washes, as described above. Nuclei were stained with Hoechst 33342 (Thermo Fisher Scientific, H3570), used at final concentration of 1:10,000. All antibodies were diluted in 0.1% Triton-X and 2% horse serum, and all solutions were made with 1× PBS. All myotubes were imaged on Zeiss Axio Observer Z.1 inverted microscope. Primary antibodies and dilutions used are as follows: MyoD (C-20) at 1:1,000 (Santa Cruz Biotechnology, sc-304), α-actinin at 1:1,000 (MilliporeSigma, A7811), and dystrophin at 1:1,000 (Thermo Fisher Scientific, PA1-37587). MBNL1 (A2764) was used at 1:3,000 and was a gift from the laboratory of Charles Thornton (University of Rochester, Rochester, New York, USA) (16). Secondary antibodies were all from Thermo Fisher Scientific and were used at 1:1,000. These are as follows: Alexa Fluor 488 donkey anti-rabbit (A21206), Alexa Fluor 488 donkey anti-mouse (A21202), Alexa Fluor 594 donkey anti-rabbit (A21207), and Alexa Fluor 594 donkey anti-mouse (A21203).
IFM of iPSC and iPSC-CMs was performed as described above. Coverslips were mounted using Vectashield Antifade Mounting Medium (Vector Laboratories, H-1000) or ProLong Gold Antifade Mountant (Thermo Fisher Scientific, P36930). All iPSC and iPSC-derived cardiomyocytes were imaged on Zeiss Axio Observer epifluorescence microscope with Apotome 2. Primary antibodies and dilutions used were as follows: SSEA-4 at 1:1,000 (Santa Cruz Biotechnology, sc-21704), Tra-1-60 at 1:1,000 (Santa Cruz Biotechnology, sc-21705), MYBPC3 (E-7) at 1:1,000 (Santa Cruz Biotechnology, sc-137180), and MBNL1 (4A8) at 1:1,000 (MilliporeSigma, MABE70). Actin was labeled with Alexa Fluor 488 Phalloidin at 1:1,000 (Thermo Fisher Scientific, A12379). Secondary antibodies were all from Thermo Fisher Scientific and were used at 1:1,000. These are as follows: Alexa Fluor 594 goat anti-mouse IgM (A21044), Alexa Fluor 488 donkey anti-rabbit (A21206), Alexa Fluor 488 donkey anti-mouse (A21202), Alexa Fluor 594 donkey anti-rabbit (A21207), and Alexa Fluor 594 donkey anti-mouse (A21203).
Single cell imaging and spatial correlation analysis.
iPSC-derived cardiomyocytes were fixed, and FISH for RNA repeat regions was performed as described above, with modifications outlined below. After overnight hybridization, the first posthybridization wash was done 3 times using 2× SSC buffer with 50% formamide at 55°C, 10 minutes per wash. The FISH probes for single cell imaging were (CAG)10 for DM1 and (CAGG)5 for DM2 patient cells, labeled at 5′ end with Alexa Fluor 647, and were resuspended in UltraPure Distilled Water to stock concentration of 1 μg/μl. Following FISH, the cells were probed for MBNL1 as described above. Briefly, the cells were blocked in 10% horse serum for 30 minutes to 1 hour at 4°C and then labeled with anti-MBNL1 (4A8) at 1:1,000 (MilliporeSigma, MABE70). Alexa Fluor 488 donkey anti-mouse (Thermo Fisher Scientific, A21202) was used at 1:1,000 as a secondary antibody. Nuclei were stained with Hoechst 33342 (Thermo Fisher Scientific, H3570), used at final concentration of 1:10,000.
Single cell images were captured under a total internal reflection fluorescence objective (Nikon CFI apochromat 100×, 1.49 NA). The 473-nm and 645-nm lasers were used to excite fluorescence from Alexa Fluor 488 and Alexa Fluor 647 fluorophores, respectively. Five hundred images were recorded using an EMCCD camera (Andor Technology, iXon Ultra 897) at a frame rate of 50 Hz with field of view of 40 × 40 μm. Oxygen scavenging imaging buffer was freshly made and contained 50 mM Tris (pH 8.0; T1503) and 10 mM NaCl (S5150), 0.5 mg/ml glucose oxidase (G2133), 40 μg/ml catalase (C40), 10% (wt/vol) D-glucose (158968), and 143 mM β-mercaptoethanol (63689). All chemicals used in the buffer were purchased from MilliporeSigma. Spatial correlation between mRNA and MBNL1 protein was performed to characterize foci formation in DM1 (CTG) and DM2 (CCTG). Pair correlation functions (g[r]) were calculated using custom Matlab code. For each patient, the distances between the mRNA clusters and the nearest MBNL1 proteins were calculated and pooled for 14–16 cells, and a histogram was generated.
Dystrophin quantification.
All images were acquired identically on Zeiss Axio Observer Z.1 inverted microscope with Zen Software. Images were postprocessed using Fiji. Background was subtracted from all images using rolling ball filter set at 200 pixels. Dystrophin and α-actinin mean fluorescence intensity were measured in individual channels across the entire field, n ≥ 2 images per condition, with multiple fibers present per image. Dystrophin mean fluorescence intensity was calculated as dystrophin mean fluorescence intensity divided by α-actinin mean fluorescence intensity. A 1-way ANOVA was performed using GraphPad Prism 7.
RNA ribonuclear foci quantification.
Immunofluorescence microscopy images of iPSC and iPSC-CMs were acquired as z-stacks and flattened using z projection function on Fiji. The number of RNA foci were counted on Fiji using Find Maxima function with noise tolerance set between 25–30. Noise tolerance that allowed for the most accurate identification of foci by Fiji was chosen for each image. The total number of nuclei were counted manually. Then, the total number of foci were divided by the total number of nuclei to calculate foci per nucleus.
Calcium transient measurements.
iPSC-derived cardiomyocytes were replated on MatTek dishes as described above. Cells were washed once with room temperature PBS and loaded with 5 μM Indo-1 Leakage Resistant dye (TEFLabs, 0145) with 0.02% pluronic F-127 (MilliporeSigma, P2443) in Tyrode’s solution for 45 minutes at 37°C. After loading, cells were placed in Tyrode’s solution. Tyrode’s solution contained 119 mM NaCl, 5 mM KCl (MilliporeSigma, P9541), 25 mM HEPES (MilliporeSigma, H3375), 2 mM CaCl2 (MilliporeSigma, C1016), and 2 mM MgCl2 (MilliporeSigma, M8266) and was pH adjusted to 7.6. D-glucose (MilliporeSigma, G7021) was freshly added to Tyrode’s solution at 6 mg/ml on the day of calcium measurements. Cells were imaged on Nikon Diaphot inverted microscope fitted with custom stage and photomultiplier tubes (PMT, Ionoptix). Cells were paced at 0.25, 0.5, 0.75, and 1 Hz using 2-millisecond pulse width and voltage between 18–20 V. Pacer had electrodes at fixed width and was powered by a stimulator (Aurora Scientific, 701C). Ten to 20 transients were recorded per trace. Video Sarcomere Length 900B software (Aurora Scientific) was used to visualize the imaged fields, and 950A Calcium Fluorescence System (Aurora Scientific) was used to record the traces and analyze the parameters of average transients. The average transients were plotted using GraphPad Prism 7, and 1-way ANOVA statistical tests were run on GraphPad Prism 7 with P < 0.05 set as statistically significant.
Cardiomyocyte differentiation efficiency estimation.
After calcium transients were measured, coverslips were separated from 35-mm dishes and probed for cMyBP-C protein using IFM as described above. Coverslips were mounted using Vectashield Antifade Mounting Medium or ProLong Gold Antifade Mountant and imaged on Zeiss Axio Observer epifluorescence microscope with Apotome 2. Z-stack images were taken from 3 random fields per coverslip. Z-stacks were collapsed using Fiji. The number of cells that show expression of cMyBP-C were counted manually, and this number was divided by the number of total nuclei in the field to estimate differentiation efficiency. Samples with at least 90% efficiency were chosen for RNA-seq.
Immunoblotting.
Protein concentration was determined using Quick Start Bradford Dye Reagent (Bio-Rad, 500-0205). Proteins were transferred to polyvinylidene difluoride membranes and blocked in StartingBlock T20 Blocking Buffer; antibodies were also diluted in StartingBlock T20 Blocking Buffer (Pierce). Primary antibodies were: anti-rbFox1 (Abcam, ab183348) and cMyBP-C (Santa Cruz Biotechnology, MYBPC3 E-7, sc-137180). Secondary antibodies conjugated to horseradish peroxidase were used at 1:5,000 (Jackson ImmunoResearch Laboratories). SuperSignal West Pico Chemiluminescent Substrate (Thermo Fisher Scientific) and a Fluor Chem E FE0538 documentation system (Protein Simple) were used for imaging.
RNA-seq sample preparation.
iPSC-CMs were replated as described above. Cells were washed once with cold PBS and collected in TRIzol. Chloroform (200 μl) was added per 1 ml of TRIzol used to collect the cells. Tubes were shaken vigorously for 15 seconds and incubated at room temperature for 5 minutes. Tubes were then centrifuged at 12,000 g for 15 minutes at 4°C. Clear aqueous phase (about 400–450 μl) was collected and moved to a new tube, and an equal volume of 70% ethanol was added. RNA was then isolated using Aurum Total RNA Mini Kit (Bio-Rad, 7326820) as described here. RNA was bound to columns by centrifuging at 12,000 g for 60 seconds at room temperature. Low-stringency solution (700 μl) was added to the columns, and samples were centrifuged for 30 seconds at 12,000 g. DNase solution (80 μl) was added to the columns, and the samples were incubated at room temperature for 15 minutes. Columns were centrifuged for 30 seconds at 12,000 g. High-stringency wash solution (700 μl) was added to the columns, and samples were centrifuged for 30 seconds at 12,000 g. Finally, 700 μl of low-stringency wash solution was added to the columns, and the samples were centrifuged at 12,000 g for 60 seconds. The flow-through was discarded, and the columns were centrifuged again for 2 minutes at 12,000 g. RNA was eluted with UltraPure Distilled Water. RNA samples that were submitted for RNA-seq were chosen from differentiations that showed at least 90% differentiation as measured by counting the number of cells that showed cMyBP-C expression through IFM. RNA quality check, cDNA library preparation, and sequencing were performed at the NUSeq Core Facility at Northwestern University. Sample were sequenced on Illumina HiSeq 4000 for 150-bp paired-end sequencing.
RNA-seq gene expression analysis.
RNA-seq reads were aligned using STAR 2.5.2 to the human genome assembly hg38. Transcripts were assessed and quantitated using HT-seq and analyzed for differential expression using EdgeR. Counts per million (CPM) were used to calculate differential expression. Comparisons were done pairwise for control vs. DM1 and control vs. DM2. Significant genes (FDR < 0.05) with an absolute fold-change >2 were used for subsequent analysis. Genes <2 CPM were excluded. Heatmaps were made from Z-scores calculated from log-transformed CPM values per gene. Overrepresented pathways and gene ontologies were identified was using InnateDB (60). A hypergeometric analysis algorithm was used to determine significant terms, and Benjamini Hochberg correction was applied to resulting P values. Significant terms (adjusted P < 0.05) were selected for differentially expressed genes between groups. Data was deposited in the Gene Expression Omnibus database (https://www.ncbi.nlm.nih.gov/geo/) with the accession number GSE125638.
RNA-seq alternative splicing analysis.
Paired-end RNA-seq reads were uniformly trimmed to 75 bp using Trimmomatic (61). Trimmed read files were aligned to the reference genome (hg19) using STAR 2.5.2. The BAM files for replicates were merged and used as inputs to MISO (Mixture of Isoforms) to generate percent-spliced-in () values for event annotations including skipped exons (SE), retained introns (RI), mutually exclusive exons (MXE), alternative 5′ splice sites (A5SS), alternative 3′ splice sites (A3SS), and complete transcripts, as described in ref. 62. MISO was used to make pair-wise comparisons: WT vs. DM1, WT vs. DM2, and DM1 vs. DM2, and it calculated Bayes factors for each comparison. Counts supporting the alternative isoform were estimated by multiplying the percent spliced in (Ψ) value with the total counts assigned to the event. Events were considered significantly differentially spliced if: (a) there were ≥20 estimated counts supporting the alternative isoform in both samples, (b) the Bayes factor was 10, and (c) the change in Ψ was ≥0.20 between the samples. MISO was also used to create sashimi plots to visualize alternatively spliced events.
Statistics.
Graphpad Prism was used to assess data distribution and apply the statistical test appropriate for data distribution. The specific comparison used is indicated for each analysis in the legends and used either 1- or 2-way ANOVA.
Study approval.
Written and informed consent was obtained from all human subjects included in the study. All work was conducted under the University of Chicago and Northwestern University’s Institutional Review Boards.
Author contributions
EYK contributed experiments, design, and writing; DYB contributed calcium measurements and interpretation; AHV and AMG contributed RNA-seq analysis; EJS contributed splicing; EJW contributed cell analysis, design, and interpretation; JLD, BD, CS, and HFZ contributed high-resolution microscopy; PP contributed cell analysis and technical support; LDC contributed patient recruitment; AD contributed image analysis; and EMM contributed design, interpretation, and manuscript writing.
Supplementary Material
Acknowledgments
This work was supported by NIH R01 HL128075, NIH T32 HD009007, F32 HL131304, T32 GM008152, and F30 HL142187. Research reported in this publication was made possible in part by the services of the NUSeq Core Facility, which is supported by the Northwestern University Center for Genetic Medicine, Feinberg School of Medicine, and Shared and Core Facilities of the University’s Office for Research. We thank the patients for their participation.
Version 1. 02/07/2019
In-Press Preview
Version 2. 03/21/2019
Electronic publication
Version 3. 03/25/2019
Alexis Demonbreun name was spelled incorrectly. The authors regret the error.
Footnotes
Phone: 312.503.6284;Email: elizabeth.mcnally@northwestern.edu.
Conflict of interest: The authors declare no competing interests or conflicts of interest.
Copyright: © 2019 American Society for Clinical Investigation
Reference information: JCI Insight. 2019;4(6):e122686. https://doi.org/10.1172/jci.insight.122686.
Contributor Information
Ellis Y. Kim, Email: eyk@uchicago.edu.
David Y. Barefield, Email: david.barefield@northwestern.edu.
Andy H. Vo, Email: ahvo@uchicago.edu.
Anthony M. Gacita, Email: anthony.gacita@northwestern.edu.
Emma J. Schuster, Email: emmaschuster2022@u.northwestern.edu.
Eugene J. Wyatt, Email: eugene.wyatt@northwestern.edu.
Janel L. Davis, Email: JanelDavis2015@u.northwestern.edu.
Biqin Dong, Email: dongbq@northwestern.edu.
Cheng Sun, Email: c-sun@northwestern.edu.
Patrick Page, Email: patrick.page@northwestern.edu.
Lisa Dellefave-Castillo, Email: lisa.m.castillo@northwestern.edu.
Hao F. Zhang, Email: hfzhang@northwestern.edu.
Elizabeth M. McNally, Email: elizabeth.mcnally@northwestern.edu.
References
- 1.Thornton CA. Myotonic dystrophy. Neurol Clin. 2014;32(3):705–719. doi: 10.1016/j.ncl.2014.04.011. [DOI] [PMC free article] [PubMed] [Google Scholar]
- 2.Meola G, Cardani R. Myotonic dystrophy type 2 and modifier genes: an update on clinical and pathomolecular aspects. Neurol Sci. 2017;38(4):535–546. doi: 10.1007/s10072-016-2805-5. [DOI] [PubMed] [Google Scholar]
- 3.Udd B, Krahe R. The myotonic dystrophies: molecular, clinical, and therapeutic challenges. Lancet Neurol. 2012;11(10):891–905. doi: 10.1016/S1474-4422(12)70204-1. [DOI] [PubMed] [Google Scholar]
- 4.Brook JD, et al. Radiation-reduced hybrids for the myotonic dystrophy locus. Genomics. 1992;13(2):243–250. doi: 10.1016/0888-7543(92)90238-N. [DOI] [PubMed] [Google Scholar]
- 5.Mahadevan M, et al. Myotonic dystrophy mutation: an unstable CTG repeat in the 3′ untranslated region of the gene. Science. 1992;255(5049):1253–1255. doi: 10.1126/science.1546325. [DOI] [PubMed] [Google Scholar]
- 6.Fu YH, et al. An unstable triplet repeat in a gene related to myotonic muscular dystrophy. Science. 1992;255(5049):1256–1258. doi: 10.1126/science.1546326. [DOI] [PubMed] [Google Scholar]
- 7.Ranum LP, Rasmussen PF, Benzow KA, Koob MD, Day JW. Genetic mapping of a second myotonic dystrophy locus. Nat Genet. 1998;19(2):196–198. doi: 10.1038/570. [DOI] [PubMed] [Google Scholar]
- 8.Liquori CL, et al. Myotonic dystrophy type 2 caused by a CCTG expansion in intron 1 of ZNF9. Science. 2001;293(5531):864–867. doi: 10.1126/science.1062125. [DOI] [PubMed] [Google Scholar]
- 9.Meola G, Cardani R. Myotonic dystrophies: An update on clinical aspects, genetic, pathology, and molecular pathomechanisms. Biochim Biophys Acta. 2015;1852(4):594–606. doi: 10.1016/j.bbadis.2014.05.019. [DOI] [PubMed] [Google Scholar]
- 10.Day JW, et al. Myotonic dystrophy type 2: molecular, diagnostic and clinical spectrum. Neurology. 2003;60(4):657–664. doi: 10.1212/01.WNL.0000054481.84978.F9. [DOI] [PubMed] [Google Scholar]
- 11.Taneja KL, McCurrach M, Schalling M, Housman D, Singer RH. Foci of trinucleotide repeat transcripts in nuclei of myotonic dystrophy cells and tissues. J Cell Biol. 1995;128(6):995–1002. doi: 10.1083/jcb.128.6.995. [DOI] [PMC free article] [PubMed] [Google Scholar]
- 12.Mankodi A, et al. Muscleblind localizes to nuclear foci of aberrant RNA in myotonic dystrophy types 1 and 2. Hum Mol Genet. 2001;10(19):2165–2170. doi: 10.1093/hmg/10.19.2165. [DOI] [PubMed] [Google Scholar]
- 13.Davis BM, McCurrach ME, Taneja KL, Singer RH, Housman DE. Expansion of a CUG trinucleotide repeat in the 3′ untranslated region of myotonic dystrophy protein kinase transcripts results in nuclear retention of transcripts. Proc Natl Acad Sci USA. 1997;94(14):7388–7393. doi: 10.1073/pnas.94.14.7388. [DOI] [PMC free article] [PubMed] [Google Scholar]
- 14.Fardaei M, et al. Three proteins, MBNL, MBLL and MBXL, co-localize in vivo with nuclear foci of expanded-repeat transcripts in DM1 and DM2 cells. Hum Mol Genet. 2002;11(7):805–814. doi: 10.1093/hmg/11.7.805. [DOI] [PubMed] [Google Scholar]
- 15.Mankodi A, Teng-Umnuay P, Krym M, Henderson D, Swanson M, Thornton CA. Ribonuclear inclusions in skeletal muscle in myotonic dystrophy types 1 and 2. Ann Neurol. 2003;54(6):760–768. doi: 10.1002/ana.10763. [DOI] [PubMed] [Google Scholar]
- 16.Lin X, et al. Failure of MBNL1-dependent post-natal splicing transitions in myotonic dystrophy. Hum Mol Genet. 2006;15(13):2087–2097. doi: 10.1093/hmg/ddl132. [DOI] [PubMed] [Google Scholar]
- 17.Savkur RS, Philips AV, Cooper TA. Aberrant regulation of insulin receptor alternative splicing is associated with insulin resistance in myotonic dystrophy. Nat Genet. 2001;29(1):40–47. doi: 10.1038/ng704. [DOI] [PubMed] [Google Scholar]
- 18.Mankodi A, et al. Expanded CUG repeats trigger aberrant splicing of ClC-1 chloride channel pre-mRNA and hyperexcitability of skeletal muscle in myotonic dystrophy. Mol Cell. 2002;10(1):35–44. doi: 10.1016/S1097-2765(02)00563-4. [DOI] [PubMed] [Google Scholar]
- 19.Wang GS, Kearney DL, De Biasi M, Taffet G, Cooper TA. Elevation of RNA-binding protein CUGBP1 is an early event in an inducible heart-specific mouse model of myotonic dystrophy. J Clin Invest. 2007;117(10):2802–2811. doi: 10.1172/JCI32308. [DOI] [PMC free article] [PubMed] [Google Scholar]
- 20.Suominen T, et al. Population frequency of myotonic dystrophy: higher than expected frequency of myotonic dystrophy type 2 (DM2) mutation in Finland. Eur J Hum Genet. 2011;19(7):776–782. doi: 10.1038/ejhg.2011.23. [DOI] [PMC free article] [PubMed] [Google Scholar]
- 21.Bhakta D, Groh MR, Shen C, Pascuzzi RM, Groh WJ. Increased mortality with left ventricular systolic dysfunction and heart failure in adults with myotonic dystrophy type 1. Am Heart J. 2010;160(6):1137–1141. doi: 10.1016/j.ahj.2010.07.032. [DOI] [PubMed] [Google Scholar]
- 22.Schmacht L, et al. Cardiac Involvement in Myotonic Dystrophy Type 2 Patients With Preserved Ejection Fraction: Detection by Cardiovascular Magnetic Resonance. Circ Cardiovasc Imaging. 2016;9:e004615. doi: 10.1161/CIRCIMAGING.115.004615. [DOI] [PubMed] [Google Scholar]
- 23.Groh WJ, et al. Electrocardiographic abnormalities and sudden death in myotonic dystrophy type 1. N Engl J Med. 2008;358(25):2688–2697. doi: 10.1056/NEJMoa062800. [DOI] [PubMed] [Google Scholar]
- 24.Tanawuttiwat T, Wagner KR, Tomaselli G, Nazarian S. Left Ventricular Dysfunction and Conduction Disturbances in Patients With Myotonic Muscular Dystrophy Type I and II. JAMA Cardiol. 2017;2(2):225–228. doi: 10.1001/jamacardio.2016.4145. [DOI] [PubMed] [Google Scholar]
- 25.Petri H, Vissing J, Witting N, Bundgaard H, Køber L. Cardiac manifestations of myotonic dystrophy type 1. Int J Cardiol. 2012;160(2):82–88. doi: 10.1016/j.ijcard.2011.08.037. [DOI] [PubMed] [Google Scholar]
- 26.Philips AV, Timchenko LT, Cooper TA. Disruption of splicing regulated by a CUG-binding protein in myotonic dystrophy. Science. 1998;280(5364):737–741. doi: 10.1126/science.280.5364.737. [DOI] [PubMed] [Google Scholar]
- 27.Freyermuth F, et al. Splicing misregulation of SCN5A contributes to cardiac-conduction delay and heart arrhythmia in myotonic dystrophy. Nat Commun. 2016;7:11067. doi: 10.1038/ncomms11067. [DOI] [PMC free article] [PubMed] [Google Scholar]
- 28.Kanadia RN, et al. A muscleblind knockout model for myotonic dystrophy. Science. 2003;302(5652):1978–1980. doi: 10.1126/science.1088583. [DOI] [PubMed] [Google Scholar]
- 29.Mankodi A, et al. Myotonic dystrophy in transgenic mice expressing an expanded CUG repeat. Science. 2000;289(5485):1769–1773. doi: 10.1126/science.289.5485.1769. [DOI] [PubMed] [Google Scholar]
- 30.Orengo JP, Chambon P, Metzger D, Mosier DR, Snipes GJ, Cooper TA. Expanded CTG repeats within the DMPK 3′ UTR causes severe skeletal muscle wasting in an inducible mouse model for myotonic dystrophy. Proc Natl Acad Sci USA. 2008;105(7):2646–2651. doi: 10.1073/pnas.0708519105. [DOI] [PMC free article] [PubMed] [Google Scholar]
- 31.Kim EY, Page P, Dellefave-Castillo LM, McNally EM, Wyatt EJ. Direct reprogramming of urine-derived cells with inducible MyoD for modeling human muscle disease. Skelet Muscle. 2016;6:32. doi: 10.1186/s13395-016-0103-9. [DOI] [PMC free article] [PubMed] [Google Scholar]
- 32.Kimura E, et al. Cell-lineage regulated myogenesis for dystrophin replacement: a novel therapeutic approach for treatment of muscular dystrophy. Hum Mol Genet. 2008;17(16):2507–2517. doi: 10.1093/hmg/ddn151. [DOI] [PMC free article] [PubMed] [Google Scholar]
- 33.Amack JD, Mahadevan MS. Myogenic defects in myotonic dystrophy. Dev Biol. 2004;265(2):294–301. doi: 10.1016/j.ydbio.2003.07.021. [DOI] [PubMed] [Google Scholar]
- 34.Timchenko NA, Iakova P, Cai ZJ, Smith JR, Timchenko LT. Molecular basis for impaired muscle differentiation in myotonic dystrophy. Mol Cell Biol. 2001;21(20):6927–6938. doi: 10.1128/MCB.21.20.6927-6938.2001. [DOI] [PMC free article] [PubMed] [Google Scholar]
- 35.Mankodi A, Lin X, Blaxall BC, Swanson MS, Thornton CA. Nuclear RNA foci in the heart in myotonic dystrophy. Circ Res. 2005;97(11):1152–1155. doi: 10.1161/01.RES.0000193598.89753.e3. [DOI] [PubMed] [Google Scholar]
- 36.Dixon DM, et al. Loss of muscleblind-like 1 results in cardiac pathology and persistence of embryonic splice isoforms. Sci Rep. 2015;5:9042. doi: 10.1038/srep09042. [DOI] [PMC free article] [PubMed] [Google Scholar]
- 37.Sellier C, et al. rbFOX1/MBNL1 competition for CCUG RNA repeats binding contributes to myotonic dystrophy type 1/type 2 differences. Nat Commun. 2018;9(1):2009. doi: 10.1038/s41467-018-04370-x. [DOI] [PMC free article] [PubMed] [Google Scholar]
- 38.Lau JK, Sy RW, Corbett A, Kritharides L. Myotonic dystrophy and the heart: A systematic review of evaluation and management. Int J Cardiol. 2015;184:600–608. doi: 10.1016/j.ijcard.2015.03.069. [DOI] [PubMed] [Google Scholar]
- 39.Lattanzi L, et al. High efficiency myogenic conversion of human fibroblasts by adenoviral vector-mediated MyoD gene transfer. An alternative strategy for ex vivo gene therapy of primary myopathies. J Clin Invest. 1998;101(10):2119–2128. doi: 10.1172/JCI1505. [DOI] [PMC free article] [PubMed] [Google Scholar]
- 40.Lukáš Z, et al. Sequestration of MBNL1 in tissues of patients with myotonic dystrophy type 2. Neuromuscul Disord. 2012;22(7):604–616. doi: 10.1016/j.nmd.2012.03.004. [DOI] [PubMed] [Google Scholar]
- 41.Cardani R, et al. Progression of muscle histopathology but not of spliceopathy in myotonic dystrophy type 2. Neuromuscul Disord. 2014;24(12):1042–1053. doi: 10.1016/j.nmd.2014.06.435. [DOI] [PubMed] [Google Scholar]
- 42.Arandel L, et al. Immortalized human myotonic dystrophy muscle cell lines to assess therapeutic compounds. Dis Model Mech. 2017;10(4):487–497. doi: 10.1242/dmm.027367. [DOI] [PMC free article] [PubMed] [Google Scholar]
- 43.Perfetti A, et al. Genome wide identification of aberrant alternative splicing events in myotonic dystrophy type 2. PLoS ONE. 2014;9(4):e93983. doi: 10.1371/journal.pone.0093983. [DOI] [PMC free article] [PubMed] [Google Scholar]
- 44.Kanadia RN, et al. Reversal of RNA missplicing and myotonia after muscleblind overexpression in a mouse poly(CUG) model for myotonic dystrophy. Proc Natl Acad Sci USA. 2006;103(31):11748–11753. doi: 10.1073/pnas.0604970103. [DOI] [PMC free article] [PubMed] [Google Scholar]
- 45.Kurtz A. Pflügers Archiv historical article-a new category of papers in Pflügers Archiv-European Journal of Physiology. Pflugers Arch. 2016;468(7):1113. doi: 10.1007/s00424-016-1855-0. [DOI] [PubMed] [Google Scholar]
- 46.Smith JGW, et al. Isogenic Pairs of hiPSC-CMs with Hypertrophic Cardiomyopathy/LVNC-Associated ACTC1 E99K Mutation Unveil Differential Functional Deficits. Stem Cell Reports. 2018;11(5):1226–1243. doi: 10.1016/j.stemcr.2018.10.006. [DOI] [PMC free article] [PubMed] [Google Scholar]
- 47.Viswanathan SK, et al. Association of Cardiomyopathy With MYBPC3 D389V and MYBPC3Δ25bpIntronic Deletion in South Asian Descendants. JAMA Cardiol. 2018;3(6):481–488. doi: 10.1001/jamacardio.2018.0618. [DOI] [PMC free article] [PubMed] [Google Scholar]
- 48.Sansone VA, et al. The frequency and severity of cardiac involvement in myotonic dystrophy type 2 (DM2): long-term outcomes. Int J Cardiol. 2013;168(2):1147–1153. doi: 10.1016/j.ijcard.2012.11.076. [DOI] [PubMed] [Google Scholar]
- 49.Santoro M, et al. Alternative splicing alterations of Ca2+ handling genes are associated with Ca2+ signal dysregulation in myotonic dystrophy type 1 (DM1) and type 2 (DM2) myotubes. Neuropathol Appl Neurobiol. 2014;40(4):464–476. doi: 10.1111/nan.12076. [DOI] [PubMed] [Google Scholar]
- 50.Zu T, et al. Non-ATG-initiated translation directed by microsatellite expansions. Proc Natl Acad Sci USA. 2011;108(1):260–265. doi: 10.1073/pnas.1013343108. [DOI] [PMC free article] [PubMed] [Google Scholar]
- 51.Zu T, et al. RAN Translation Regulated by Muscleblind Proteins in Myotonic Dystrophy Type 2. Neuron. 2017;95(6):1292–1305.e5. doi: 10.1016/j.neuron.2017.08.039. [DOI] [PMC free article] [PubMed] [Google Scholar]
- 52.Axford MM, López-Castel A, Nakamori M, Thornton CA, Pearson CE. Replacement of the myotonic dystrophy type 1 CTG repeat with ‘non-CTG repeat’ insertions in specific tissues. J Med Genet. 2011;48(7):438–443. doi: 10.1136/jmg.2010.085944. [DOI] [PMC free article] [PubMed] [Google Scholar]
- 53.Tomé S, et al. Unusual association of a unique CAG interruption in 5′ of DM1 CTG repeats with intergenerational contractions and low somatic mosaicism. Hum Mutat. 2018;39(7):970–982. doi: 10.1002/humu.23531. [DOI] [PubMed] [Google Scholar]
- 54.Larsen J, et al. Myoblasts generated by lentiviral mediated MyoD transduction of myotonic dystrophy type 1 (DM1) fibroblasts can be used for assays of therapeutic molecules. BMC Res Notes. 2011;4:490. doi: 10.1186/1756-0500-4-490. [DOI] [PMC free article] [PubMed] [Google Scholar]
- 55.Konieczny P, Selma-Soriano E, Rapisarda AS, Fernandez-Costa JM, Perez-Alonso M, Artero R. Myotonic dystrophy: candidate small molecule therapeutics. Drug Discov Today. 2017;22(11):1740–1748. doi: 10.1016/j.drudis.2017.07.011. [DOI] [PubMed] [Google Scholar]
- 56.Yoshida Y, Yamanaka S. Induced Pluripotent Stem Cells 10 Years Later: For Cardiac Applications. Circ Res. 2017;120(12):1958–1968. doi: 10.1161/CIRCRESAHA.117.311080. [DOI] [PubMed] [Google Scholar]
- 57.Okita K, et al. A more efficient method to generate integration-free human iPS cells. Nat Methods. 2011;8(5):409–412. doi: 10.1038/nmeth.1591. [DOI] [PubMed] [Google Scholar]
- 58.Barefield DY, et al. Experimental Modeling Supports a Role for MyBP-HL as a Novel Myofilament Component in Arrhythmia and Dilated Cardiomyopathy. Circulation. 2017;136(16):1477–1491. doi: 10.1161/CIRCULATIONAHA.117.028585. [DOI] [PMC free article] [PubMed] [Google Scholar]
- 59.de Mezer M, Wojciechowska M, Napierala M, Sobczak K, Krzyzosiak WJ. Mutant CAG repeats of Huntingtin transcript fold into hairpins, form nuclear foci and are targets for RNA interference. Nucleic Acids Res. 2011;39(9):3852–3863. doi: 10.1093/nar/gkq1323. [DOI] [PMC free article] [PubMed] [Google Scholar]
- 60.Breuer K, et al. InnateDB: systems biology of innate immunity and beyond--recent updates and continuing curation. Nucleic Acids Res. 2013;41(Database issue):D1228–D1233. doi: 10.1093/nar/gks1147. [DOI] [PMC free article] [PubMed] [Google Scholar]
- 61.Bolger AM, Lohse M, Usadel B. Trimmomatic: a flexible trimmer for Illumina sequence data. Bioinformatics. 2014;30(15):2114–2120. doi: 10.1093/bioinformatics/btu170. [DOI] [PMC free article] [PubMed] [Google Scholar]
- 62.Katz Y, Wang ET, Airoldi EM, Burge CB. Analysis and design of RNA sequencing experiments for identifying isoform regulation. Nat Methods. 2010;7(12):1009–1015. doi: 10.1038/nmeth.1528. [DOI] [PMC free article] [PubMed] [Google Scholar]
Associated Data
This section collects any data citations, data availability statements, or supplementary materials included in this article.


