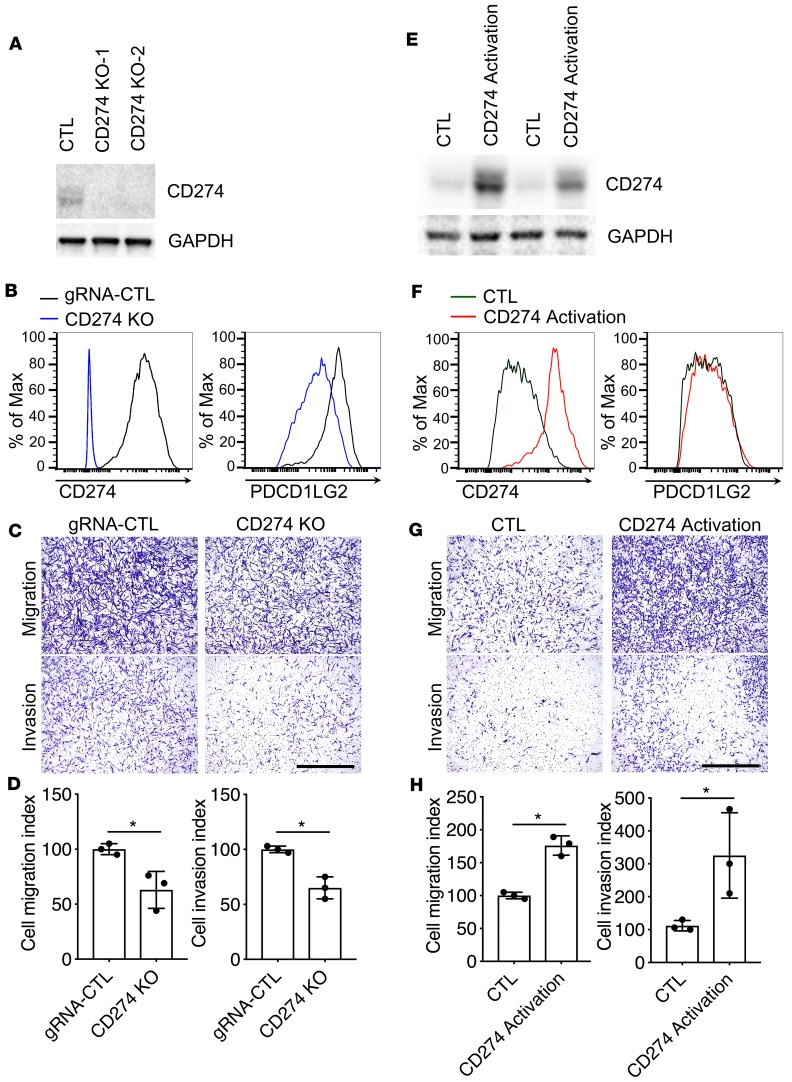
Figure 3. The expression level of CD274 was closely associated with fibroblast invasion.
(A–D) CD274 in control (CTL) and CD274-KO IPF lung fibroblasts was assessed by Western blot analysis along with GAPDH (A), and cell surface expression along with PDCD1LG2 (B), and the fibroblasts evaluated for migration and invasion (C and D). (E–H) CD274 in CTL and CD274-activated IPF lung fibroblasts was assessed by Western blot analysis along with GAPDH (E), cell surface expression along with PDCD1LG2 (F), and the fibroblasts evaluated for migration and invasion (G and H). GAPDH served as loading control. See complete unedited blots in the supplemental material. Representative images of migration and invasion are shown. Scale bars: 1 mm. Data are the mean ± SEM (n = 3 per group). *P < 0.05 by Student’s t test.

