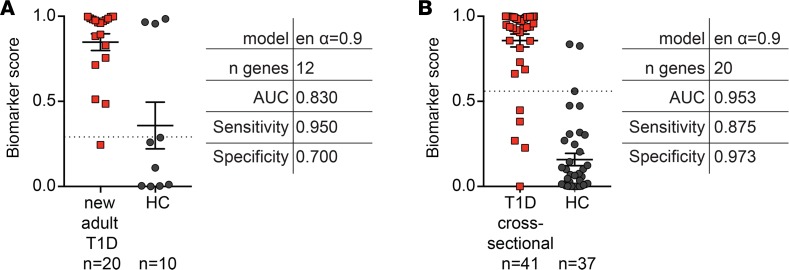
Figure 1. Altered intrinsic Treg gene signature in adults with T1D.
CD25hiCD127lo Tregs were sorted from (A) adults with new-onset T1D (n = 20) or (B) a cross-sectional T1D cohort (n = 41) and age- and sex-matched controls (n = 10 for A or n = 37 for B). The Treg gene signature in the resulting lysates was measured on the nCounter FLEX platform. Biomarker scores and details (model of biomarker analysis selected [elastic net {en}], number [n] of genes, AUC, sensitivity, and specificity) for the best algorithm differentiating between T1D and healthy controls are indicated next to biomarker score dot plots. Horizontal lines represent means, with SD represented by error bars; dashed horizontal lines represent cutoffs for sensitivity and specificity calculations.

