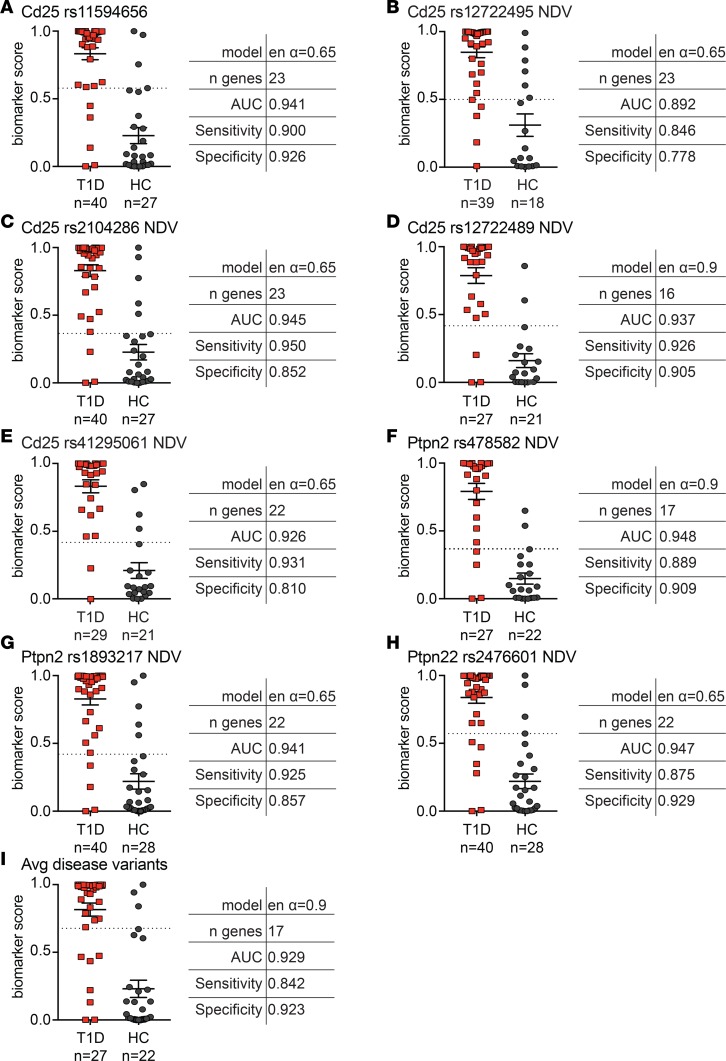
Figure 2. Addition of Treg-associated T1D SNPs enhances sensitivity of Treg-based algorithms.
New algorithms were created using combinations of the gene signature data from sorted Tregs (cross-sectional T1D and healthy cohorts), and a single indicated SNP genotype was included as a categorical value (i.e., each genotype given a specific weight) or as the number of disease variants/alleles (NDV) (i.e., 0, 1, or 2) encoding the indicated SNP. Shown are the best algorithms for each SNP (A) genotype included as categorical value and (B–H) included as NDVs. (I) Biomarker score and algorithm for gene signature data combined with the average number of (Avg) disease variants for all SNPs assessed in A–H. Horizontal lines represent means, with SD represented by error bars; dashed horizontal lines represent cutoffs for sensitivity and specificity calculations.

