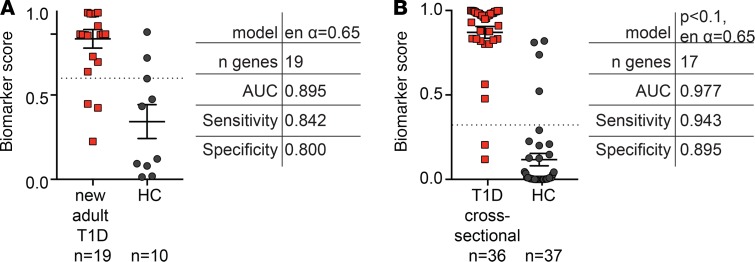
Figure 3. Detection of an altered Treg gene signature in PBMCs from adults with T1D.
The Treg gene signature was measured in PBMCs from (A) adults with new-onset T1D (n = 19) or (B) a cross-sectional T1D cohort (n = 36) and age- and sex-matched controls (n = 10 for A or n = 37 for B). Biomarker scores and details (as described in Figure 1; differential expression was assessed using a 2-tailed unpaired moderated t test from the LiMMa R package [ref. 22], with a P value threshold of 0.1) for the best algorithm differentiating between T1D and healthy controls are indicated next to biomarker score dot plots. Horizontal lines represent means, with SD represented by error bars; dashed horizontal lines represent cutoffs for sensitivity and specificity calculations.

