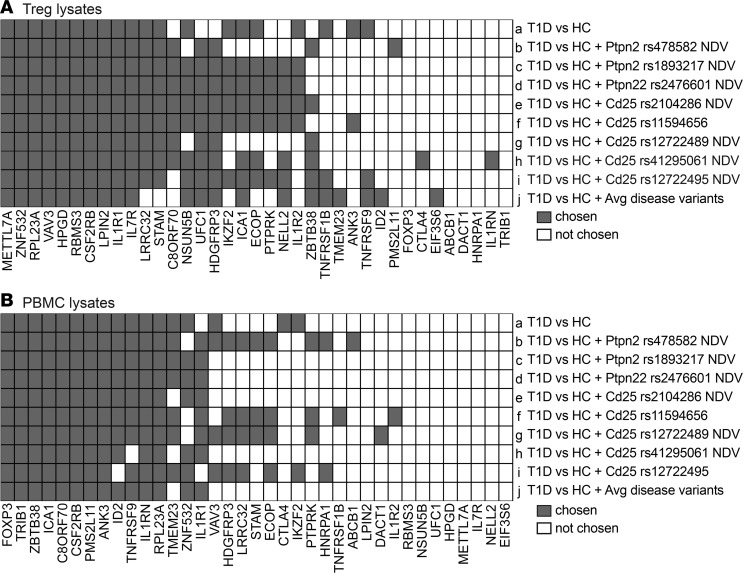
Figure 5. Differential gene usage in Treg- versus PBMC-derived algorithms.
Summary of the genes present in the best-performing algorithms from the cross-sectional T1D and healthy cohorts. (A) Treg-based algorithms described in Figure 1B and Figure 2. (B) PBMC-based algorithms described in Figure 3B and Figure 4. Each of the 37 mRNAs measured is listed; gray and white squares indicate genes that were or were not present in the best-performing algorithm, respectively.

