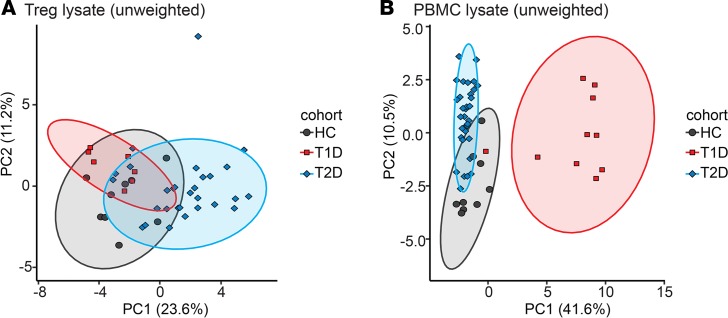
Figure 6. Altered Treg gene signature in T2D compared with T1D and healthy controls.
The Treg gene signature was measured in sorted CD25hiCD127lo Tregs and PBMCs from the indicated age- and sex-matched cohorts using the nCounter SPRINT system. For Tregs: T2D, n = 29; T1D, n = 7; and healthy controls (HC), n = 9. For PBMCs: T2D, n = 33; T1D, n = 10; and HCs, n = 9. Shown is a principal component analysis representing expression of all 37 genes by sample group in (A) Tregs or (B) PBMCs. 95% confidence intervals are overlaid as ellipses. T1D, type 1 diabetes; T2D, type 2 diabetes.

