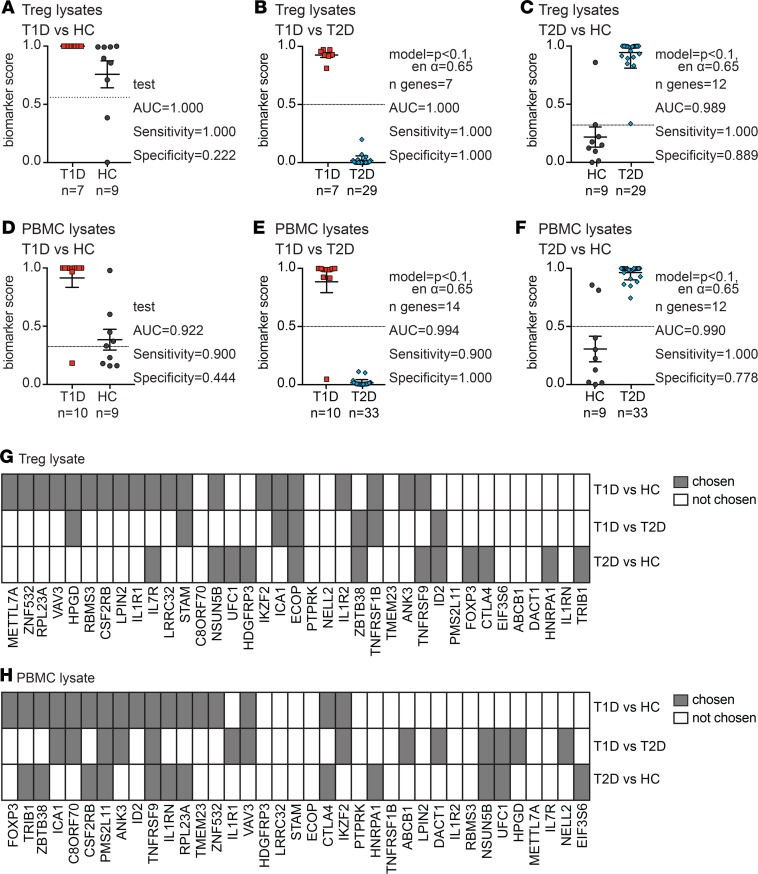
Figure 7. Treg gene signature algorithms differentiate type 1 or type 2 diabetes and healthy controls.
PBMC and Treg lysates from the indicated type 1 diabetes (T1D) or type 2 diabetes (T2D) cohorts were run on a nCounter SPRINT system together with age- and sex-matched healthy control (HC) samples. (A) Biomarker scores and performance when the algorithm from Figure 1B was applied to T1D and HC Treg data. (B and C) Biomarker scores and details (as described in Figure 1) of the best biomarker algorithm differentiating between Tregs from (B) T1D or (C) HCs and T2D samples. (D) Biomarker scores and performance when the algorithm from Figure 3B was applied to T1D and HC PBMC data. (E and F) Biomarker scores and details (as described in Figures 1 and 3) of the best biomarker algorithm differentiating between (E) T1D or (F) control and T2D samples in PBMCs. Horizontal lines represent means, with SD represented by error bars; dashed horizontal lines represent cutoffs for sensitivity and specificity calculations. (G and H) Summary of gene usage in each (G) Treg- or (H) PBMC-based algorithm described in A–F. Each of the 37 mRNAs measured is listed; gray and white squares indicate genes that were or were not present in the best-performing algorithm, respectively.

