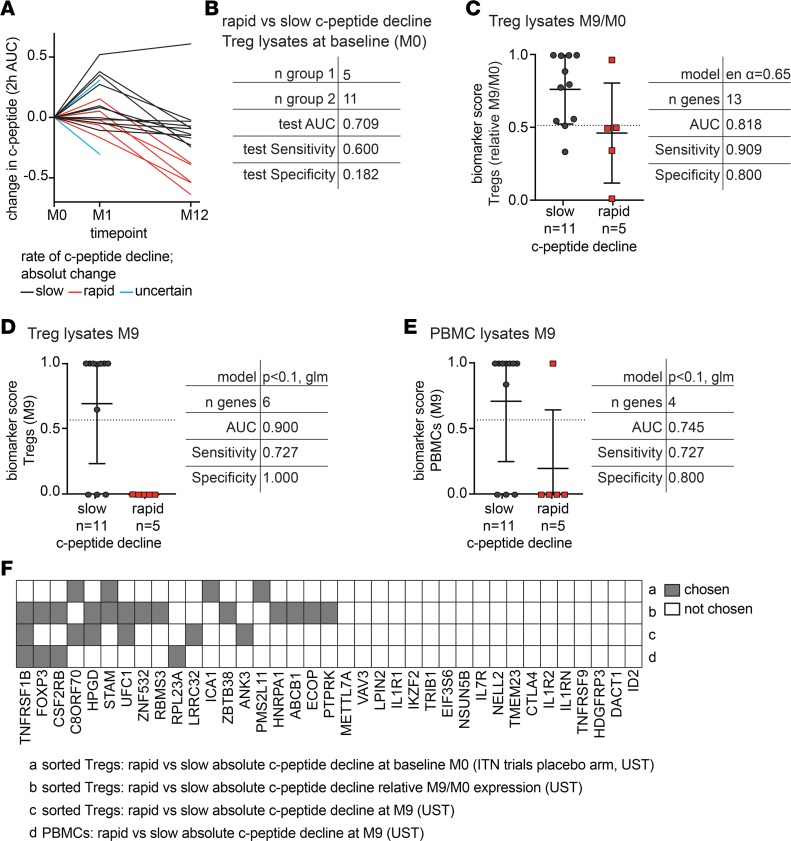
Figure 9. The Treg gene signature as a predictive biomarker of C-peptide decline in T1D subjects treated with ustekinumab.
Adult new-onset T1D patients were treated with ustekinumab, as outlined in the CONSORT flow diagram in Supplemental Figure 3. (A) C-peptide was quantified (2h AUC MMTT) at baseline (M0), 1 month (M1), and 12 months (M12), and absolute change in C-peptide from M0 to M12 was calculated. Subjects were divided into those with slow (n = 11) or rapid (n = 5) decline based on the absolute decline at M12, with slow subjects defined as those who lost less than 0.3 pmol C-peptide/year. (B–E) The TGS was measured in sorted CD25hiCD127lo Tregs or PBMCs from M0 and M9 samples. (B) Test details when the algorithm from Figure 8B was applied to M0 Treg data. (C) Treg-based algorithm and biomarker scores for slow versus rapid C-peptide decline using relative TGS data (M9/M0 prior to log2 transformation). (D) Treg- and (E) PBMC-based algorithm and biomarker scores using M9 TGS expression data. Horizontal lines in C–E represent means, with SD represented by error bars; dashed horizontal lines represent cutoffs for sensitivity and specificity calculations. (F) Summary of gene usage in C-peptide decline algorithms described in B–E.

