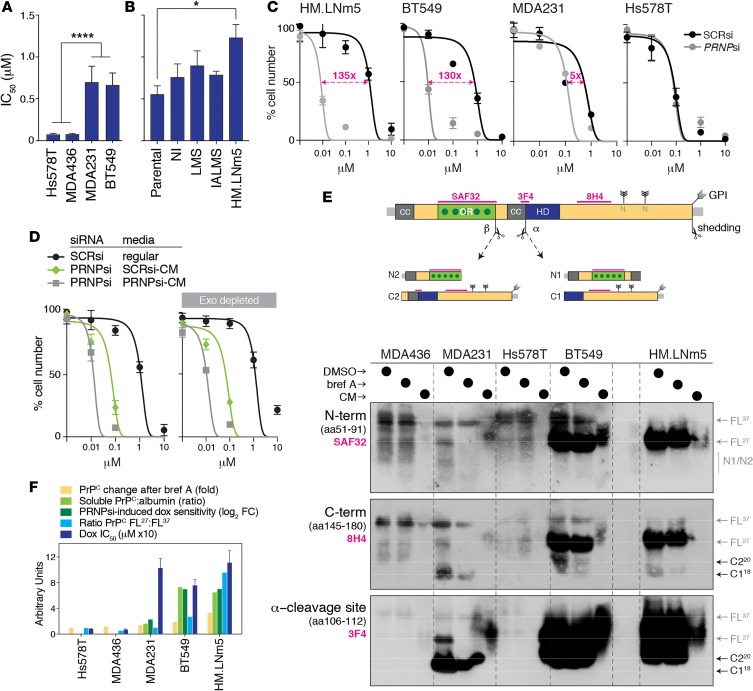
Figure 2. Soluble PrPC can mediate resistance to doxorubicin.
(A and B) Baseline doxorubicin IC50 values (mean ± SEM from 3 independent experiments) comparing cell lines secreting different levels of PrPC (****P = 0.001, comparing Hs578t/MDA436 versus MDA231/BT549; *P = 0.05, comparing HM.LNm5 and parental; see Supplemental Figure 2). P values were determined using 2-tailed Student’s t test. (C) Doxorubicin dose curves in various cell lines after depleting PrPC with siRNA (confirmation of knockdown shown in Supplemental Figure 2, C and D). SCRsi, scrambled siRNA control sequence. (D) Doxorubicin dose curves for MDA231 and HM.LNm5 cells depleted of PrPC and then supplemented with media from parallel cultures of PRNPsi or SCRsi transfectants. The experiment was also performed using equivalent media depleted of exosomes. (E) Western analysis of PrPC fragments present in lysates from 5 cell lines treated with DMSO (control) or brefeldin A, compared with conditioned medium (CM) from untreated cells. Cleavage at the α site produces N1 and C1 fragments, while β-cleavage produces N2 and C2. Shedding of full-length or C1/2 fragments occurs by proteolytic cleavage at or near the glycosylphosphatidylinositol (GPI) membrane anchor. Blots were probed with the 3 different antibodies, the epitopes for which are indicated on the PrPC schematic (drawn to scale). Protein preparations were first treated with the amidase peptide-N-glycosidase (PNGase-F) to resolve glycoprotein fragments at their respective molecular masses in denaturing conditions. CC, charged cluster domain; OR, octarepeat domain with dark-green dots as high-affinity copper-binding histidine residues; HD, hydrophobic domain; FL37, full-length glycosylated protein; FL27, full-length deglycosylated protein. N-linked glycosylation sites are also shown. (F) Summary plot of fold change across various units, demonstrating the positive association among cell lines in terms of intracellular accumulation of PrPC protein levels after brefeldin A treatment (yellow; from Figure 1, G and H), levels of PrPC protein secretion into conditioned media (light green; Figure 1I), dependence on PRNP expression for doxorubicin resistance expressed in units as doubling fold change (dark green; C), ratio of free to membrane-bound full-length PrPC (light blue; E), and the baseline doxorubicin IC50 (dark blue; Supplemental Figure 2, A and B). BT549 and HM.LNm5 were identified as the best models of soluble PrPC-associated doxorubicin resistance.

