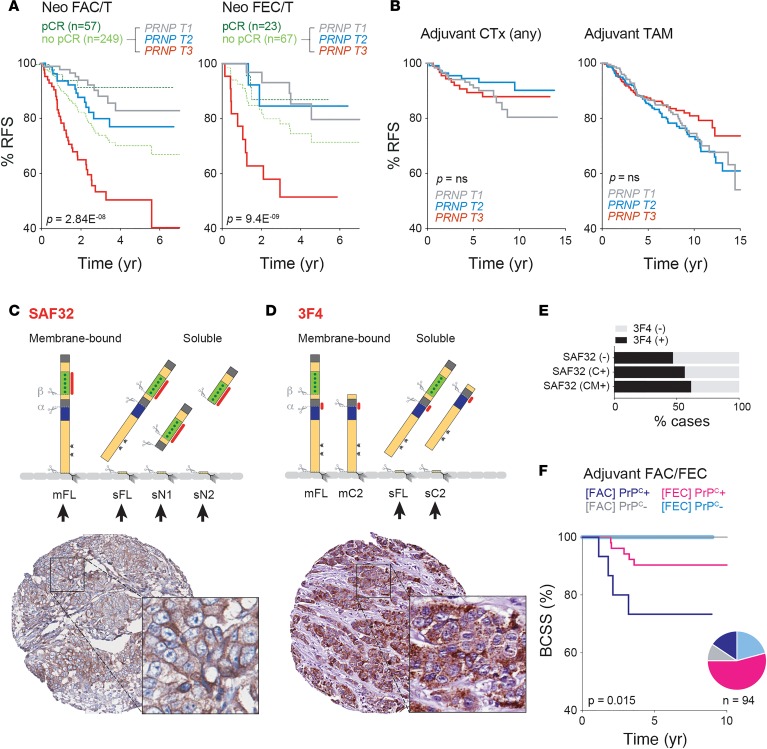
Figure 4. Relationships between tumor PrPC expression and clinical outcomes of breast cancer patients treated with anthracycline-based chemotherapy.
(A) Kaplan-Meier (KM) analysis of relationships between PRNP mRNA and relapse-free survival (RFS) using neoadjuvant trial data sets from the KM plotter database. pCR, pathologic complete response; PRNP T1-3, expression tertiles; FAC/T, fluorouracil, Adriamycin (doxorubicin), cyclophosphamide + taxane regimen; FEC/T, as for FAC/T but with epirubicin instead of Adriamycin. Log-rank tests were used to quantify the statistical significance of differences. (B) No association between PRNP expression and RFS in general chemotherapy- (CTx-) or tamoxifen (TAM-treated) cohorts. Analysis also performed using KM-Plotter data sets. (C–F) Relationships between tumor cell expression of PrPC protein isoforms and breast cancer–specific survival (BCSS) in the Brisbane Breast Bank anthracycline chemotherapy cohort (Tables 1 and 2). (C and D) Membrane-bound (m) and soluble (s) PrPC isoforms potentially detectable with SAF32 and 3F4 antibodies (epitopes highlighted red) and representative immunohistochemical (IHC) detection with SAF32 and 3F4, illustrating the typical staining patterns observed: both plasma membrane and punctate cytoplasmic staining with SAF32; stronger punctate cytoplasmic staining with 3F4. Arrows indicate the observed versus theoretically detectable isoforms. 3F4 preferentially detected soluble (sheddase processed; see Figure 2) full-length (sFL) and/or sC2 (β-cleavage product) isoforms in these conditions. Images are 600 μM in diameter (original magnification, ×40); insets are 110 μM in diameter (zoom, ×135). (E) Weak association between SAF32 and 3F4 positivity (SAF32: -, negative; C+, cytoplasm positive; CM+, cytoplasm and membrane positive). (F) KM analysis performed after categorizing cases according to positivity for either antibody. All breast cancer–related deaths in this cohort were characterized by positive tumor cell staining with SAF32 and/or 3F4 antibodies. Log-rank P value for trend is indicated. The pie chart shows proportions of the cohort in each category (also see Tables 1 and 2).

