Fig. 5.
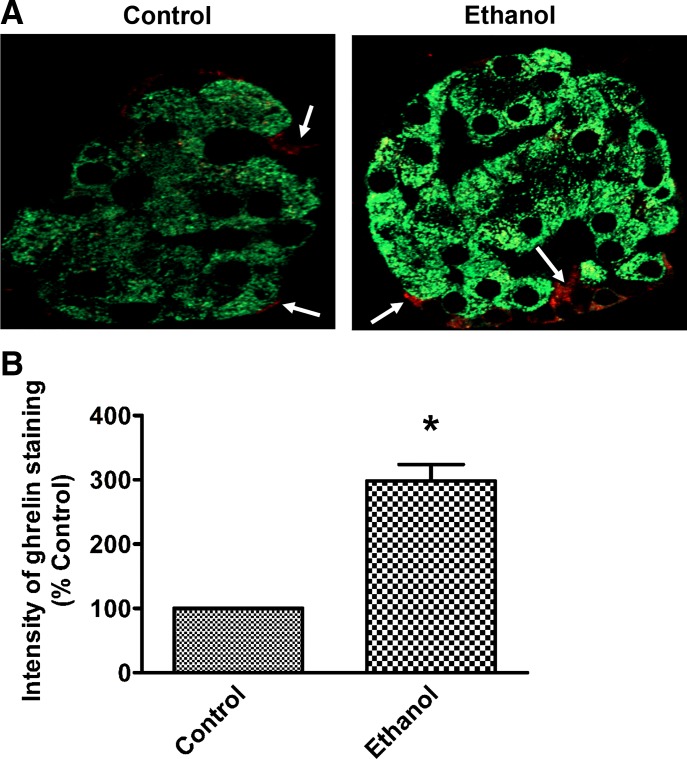
Chronic ethanol treatment increased pancreatic ghrelin content. A: representative images of control and ethanol-fed rat pancreas immunostained for insulin (green) and ghrelin (red), depicting increased ghrelin synthesis in epsilon cells of islets of chronic ethanol-fed rats. B: graphical representation of the intensity of immunohistochemical staining expressed as a percent of control. Values are means ± SE of four individual islets from each section of three sets of control and ethanol-fed animals. *P < 0.05.

