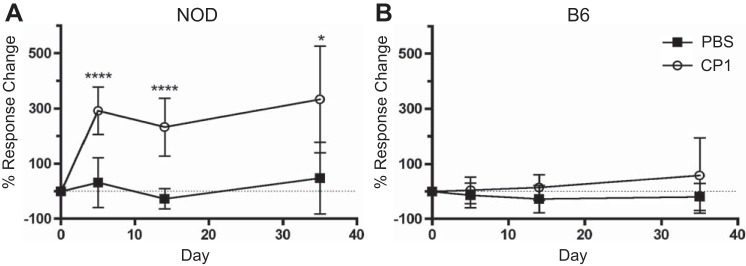
Fig. 1.
CP1-infected NOD mice, but not infected B6 mice, have increased tactile allodynia. A: percent response change in control and CP1-infected NOD tactile allodynia responses, normalized to baseline, at days 5, 14, and 35. The dashed line indicates where there is 0 response change. B: percent response change in control and CP1-infected B6 tactile allodynia responses, normalized to baseline, at days 5, 14, and 35. The dashed line indicates where there is 0 response change. The experiment was performed with 4–5 mice per time point per group. Data represent the average total response change of all 5 filaments. Results were analyzed for statistical significance by unpaired t-test. A P < 0.05 was considered statistically significant: ****P < 0.0001.

