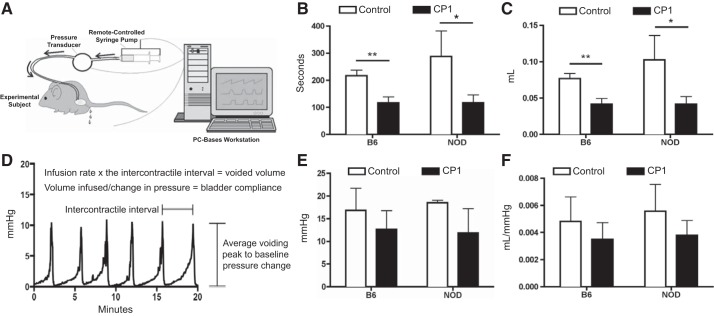
Fig. 3.
CP1 infection induces urinary dysfunction in mice. A: schematic depiction of the cystometry apparatus. [Reproduced with permission of Med Associates Inc.] B: average amount of time, in seconds, between micturition events in control and CP1-infected B6 and NOD mice at day 35. C: average volume of fluid expelled from control and CP1-infected B6 and NOD mice during micturition at day 35. D: sample cystometric trace that displays how each urinary parameter was calculated. E: average change in pressure during micturition in control and CP1-infected B6 and NOD mice at day 35. F: average voided volume from control and CP1-infected B6 and NOD divided by the average change in pressure, which conveys bladder compliance at day 35. The experiment was performed with 4 mice per group. Results were analyzed for statistical significance by unpaired t-test. A P < 0.05 was considered statistically significant: *P < 0.05, **P < 0.01.

