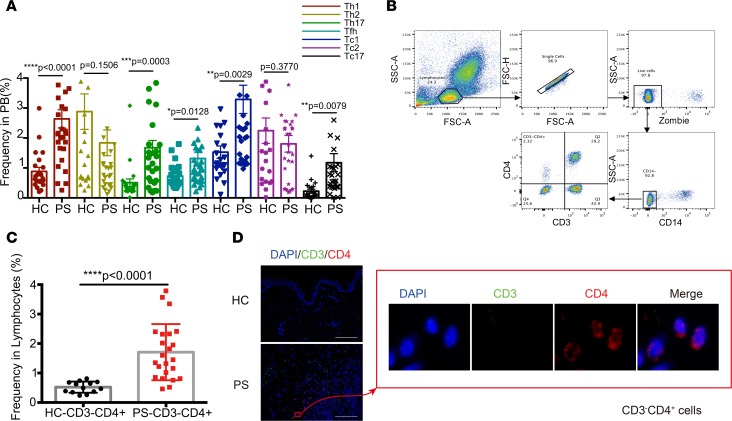
Figure 6. Validation CD3–CD4+ cells and Th subsets in an independent PS cohort.
(A) Percentages of Th cell subsets, including Tfh, Th1, Th2, Th17, Tc1, Tc2, and Tc17 cells in PBMCs, in HC (n = 23) and PS patients (n = 29). (B) CD3–CD4+ cells separating from lymphocytes by sequential gates. (C) The percentage of CD3–CD4+ cells in lymphocytes was compared between PS (n = 23) and HC (n = 13). (D) Confocal images showing immunofluorescence localization of CD3 (green), CD4 (red), and nuclear (blue). Data are representative of results of 3 experiments. Scale bars: 50 mm. *P < 0.05; ***P < 0.0005; ****P < 0.0001 as assessed by the 2-tailed Student’s t test. Data are presented as mean ± SD.

