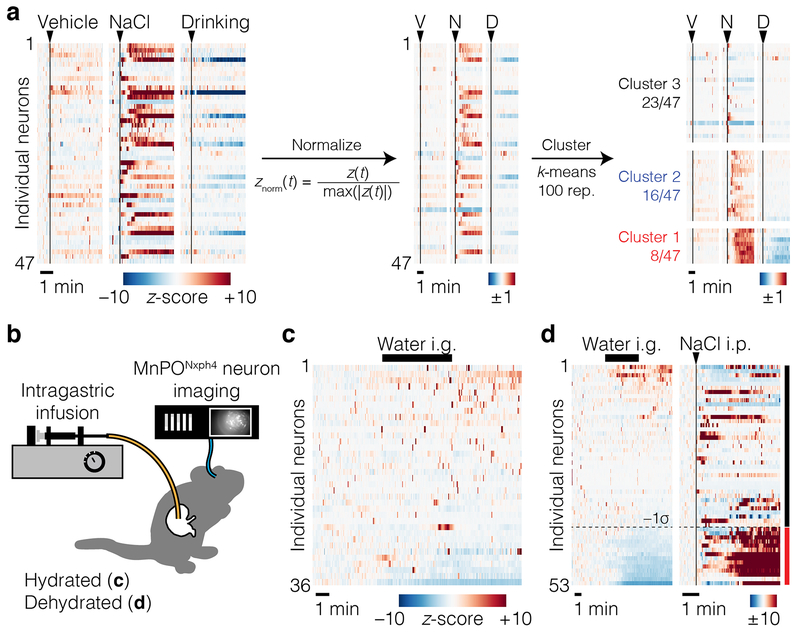
Extended Data Figure 7. In vivo imaging of individual glutamatergic MnPO neurons during thirst, drinking, and GI manipulation.
Panel a presents additional data related to Fig. 4d,e. a, Workflow for k-means clustering of individual MnPONxph4 neurons based on their activity during vehicle i.p. injection, 3 M NaCl i.p. injection, and water drinking. Panels b–d present additional data related to Fig. 4f–h. b, Schematic. c, Dynamics of individual neurons during water i.g. infusion while hydrated. d, Dynamics of individual neurons tracked during water i.g. infusion after dehydration (left) and 3 M NaCl i.p. injection (right). Neurons inhibited ≥1σ after water i.g. infusion were classified as “GI-tuned” (red; 26%) and the remaining neurons were classified as “GI-untuned” (black; 74%) for the time-course plotted in Fig. 4h.

