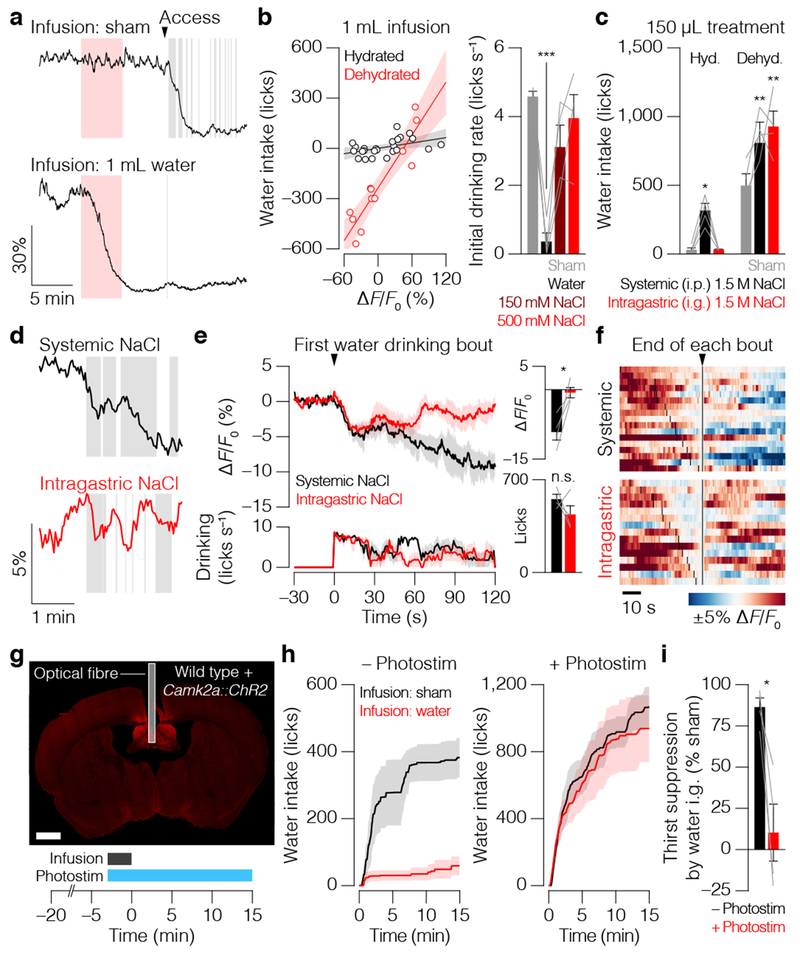
Figure 2. The GI→SFO osmosensory signal controls thirst satiation.
a, Example SFO neuron dynamics during i.g. infusion after dehydration. b, Correlation between SFO activity change and water intake (relative to sham infusion) after 1 mL infusions into hydrated (black; n = 24 experiments from 4 mice, linear regression, R2 = 0.2084, P = 0.0249) or dehydrated (red; n = 12 experiments from 4 mice, linear regression, R2 = 0.8493, P < 0.0001) mice (left). Initial drinking rate of dehydrated mice after infusion (right; n = 4 mice, one-way ANOVA, Holm-Šídák correction). c, Water intake after systemic (i.p.) or i.g. treatment with 150 μL NaCl (right; n = 4 mice, one-way ANOVA, Holm-Šídák correction; Hyd., hydrated; Dehyd., dehydrated). d, Example SFO neuron dynamics during water drinking after 150 μL NaCl treatment into dehydrated mice. e, Average SFO activity and drinking behavior after 150 μL NaCl treatment into dehydrated mice (left). Quantification (right; n = 4 mice, two-tailed Student’s t-tests). f, SFO neuron dynamics during individual water drinking bouts after systemic (17 bouts) or i.g. (15 bouts) 150 μL NaCl treatment. g, Schematic for i.g. infusion during optogenetic activation (scale bar, 1 mm). h, Dehydration-induced drinking after i.g. infusion either with (right) or without (left) simultaneous photostimulation of SFO neurons (n = 4 mice). i, Quantification (n = 4 mice, two-tailed Student’s t-test). Error bars represent mean ± s.e.m. Shaded areas in a,d represent i.g. infusion (red) or individual licks (gray); in b represent 95% confidence interval of the line-of-best-fit; in e,h represent mean ± s.e.m. *P < 0.05, **P < 0.01, ***P < 0.001; n.s., not significant.

