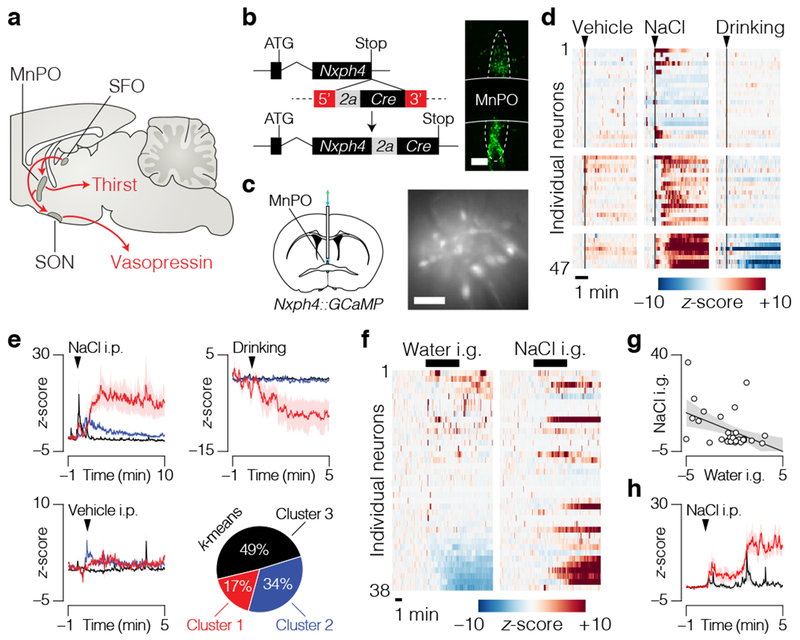
Figure 4. Individual glutamatergic MnPO neurons integrate information from the oropharynx, GI tract, and blood.
a, Illustration of the neural circuit that controls fluid homeostasis . b, Schematic for generation of the Nxph4–2a-Cre mouse line (left) and GFP-reporter recombination in the MnPO (right; scale bar, 100 μm). c, Schematic for microendoscope imaging of glutamatergic MnPO neurons (scale bar, 100 μm). d, Dynamics of individual neurons tracked during vehicle i.p. injection, 3 M NaCl i.p. injection, and water drinking. e, Average responses of neuron clusters (n = 47 neurons; see Extended Data Fig. 7a). f, Dynamics of individual neurons tracked during water i.g. infusion after dehydration (left) and during 500 mM NaCl i.g. infusion while hydrated (right). g, Correlation between the responses (z-score) of individual neurons to water i.g. and 500 mM NaCl i.g. (n = 38 neurons; linear regression, R2 = 0.2154, P = 0.0033). h, Average response to 3 M NaCl i.p. injection of neurons that were inhibited (red; 26% inhibited ≥1σ after infusion) or un-modulated (black; 74%) by water i.g. infusion (n = 53 neurons; see Extended Data Fig. 7d). Shaded areas in time-courses represent mean ± s.e.m. and in regressions represent 95% confidence interval of the line-of-best-fit.

