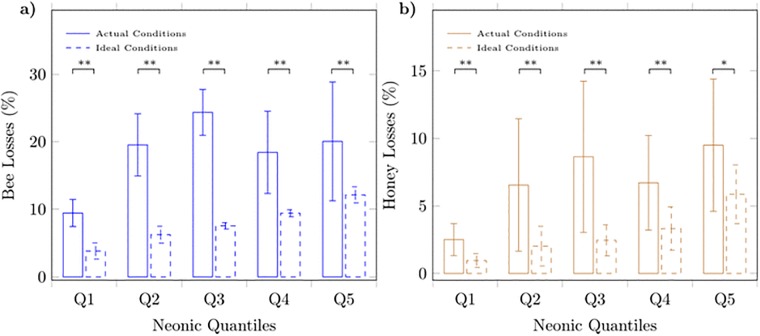
Fig 2. Honeybee and honey losses per neonicotinoid quantile under actual and under ideal conditions.
Mean losses in managed honeybee population (a) and honey production (b) under actual and ideal field conditions. Details about the construction of neonicotinoid quantiles are provided in the caption of Table 1. Solid and stippled lines refer to actual and ideal conditions, respectively. Means ± s.d. are shown separately for every neonicotinoid quantile. Results from one-tailed paired t-test are shown; **p < 0.01, *p < 0.05.

