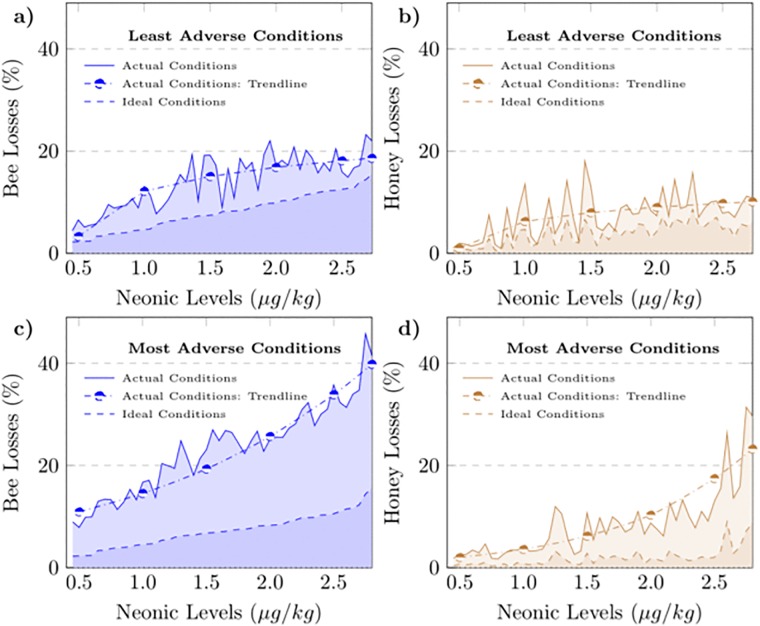
Fig 3. Honeybee and honey losses across neonicotinoid levels for apiaries facing the least and most adverse conditions.
Losses in managed honeybee population under actual and ideal conditions for apiaries facing the least adverse conditions (a), losses in honey production under actual and ideal conditions for apiaries facing the least adverse conditions (b), losses in managed honeybee population under actual and ideal conditions for apiaries facing the most adverse conditions (c), losses in honey production under actual and ideal conditions for apiaries facing the most adverse conditions (d). Based on the parameter estimates of the damage function and actual data on weather conditions and mite infestation, an index of the overall conditions prevailing at the apiaries every season was constructed. Based on the index, apiaries were classified into two equal groups with the first and second group including the apiaries facing the least and most adverse conditions, respectively. The choice of functional form for the trend lines was based on goodness-of-fit measures. Three alternative functional forms were considered for the approximation of the trend lines, namely, the linear, logarithmic and exponential functional form.

