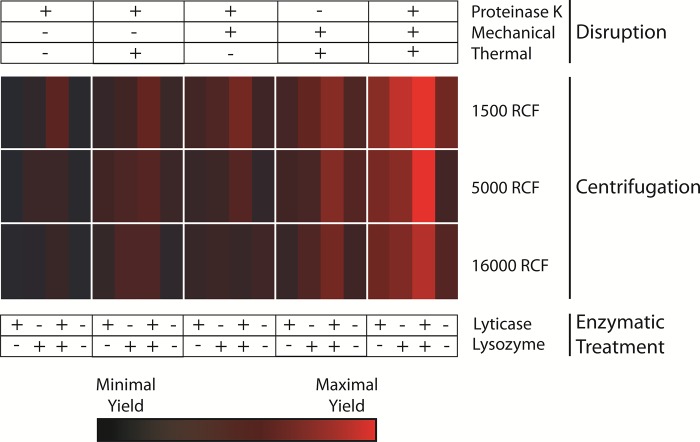
Fig 2. Large-scale confirmation of optimization of microbial DNA purification.
The individual conditions noted to increase yields were tested in aggregate in a larger-scale optimization panel. DNA was concurrently isolated from 60 identical 1 ml urine samples from each of 4 subjects with variations in cell wall disruption methods (as indicated at the top), enzymatic pre-treatment methods (bottom), and centrifugation speeds (rows indicated at right adjacent to heat map). Fungal DNA yields from these 60 variations in isolation methodology were calculated from Fungiquant qPCR as described in Fig 1, then scaled across all samples. Values are expressed as a heat map, with bright red signifying the highest yields and black the lowest yields across all samples.

