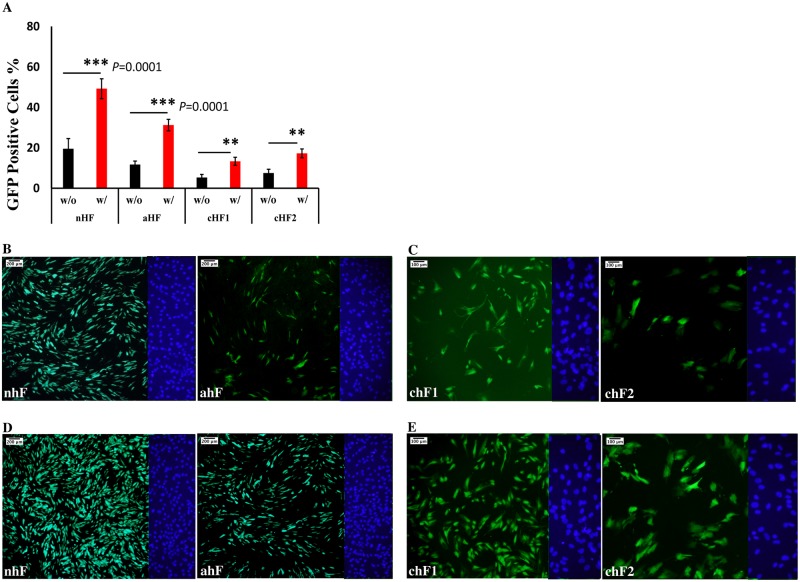
Fig 1. Optimization of the reprogramming procedure.
(A) Comparison of the GFP positive fibroblasts in different groups with (w/) and without (w/o) applying centrifugation. A paired-sample t-test was conducted to compare the percentage of transduced GFP positive cells that either underwent centrifugation or not (*** p<0.0001; ** p<0.05)(n = 3). (B) GFP expression in nhF and ahF fibroblasts 48 hours after transduction. (C) GFP expression in chF1 and chF2 48 hours after transduction. (D) GFP expression in nhF and ahF 48h after transduction and centrifugation. (E) GFP positive cells in chF1 and chF2 48h after transduction and centrifugation. DAPI staining pictures of the right side of each field were shown.

