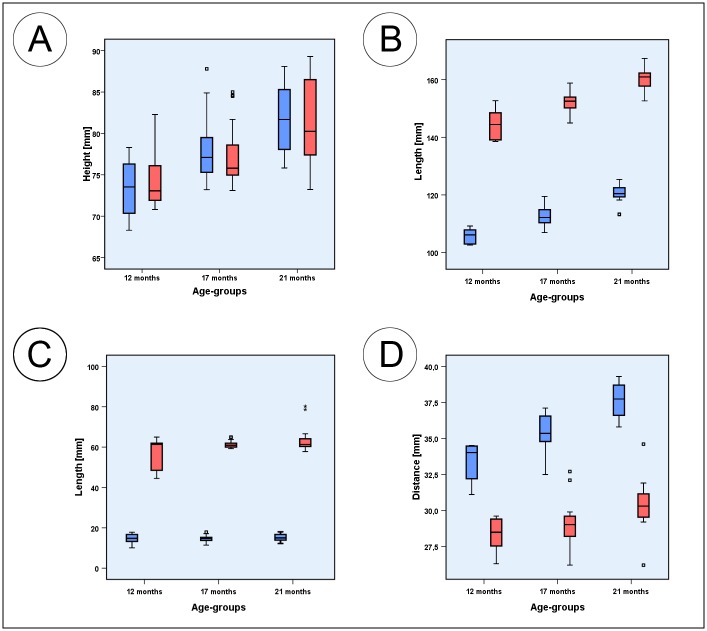
Fig 4. Box plots of measured parameters.
(A) Box plots of the mandibular ramus height (blue) and oblique mandibular ramus height (red); (B) Box plots of the inferior mandibular body length (blue) and mandibular body length (red); (C) Box plots of the diastemal length (blue) and the premolar and molar dental arch length (red); (D) Box plots of the interdiastemal breadth (blue) and lingual intercrestal breadth (red). Squares associated with the box plots are individual outliers. Outliers marked with asterisks are values that exceed the triple interquartile range.

