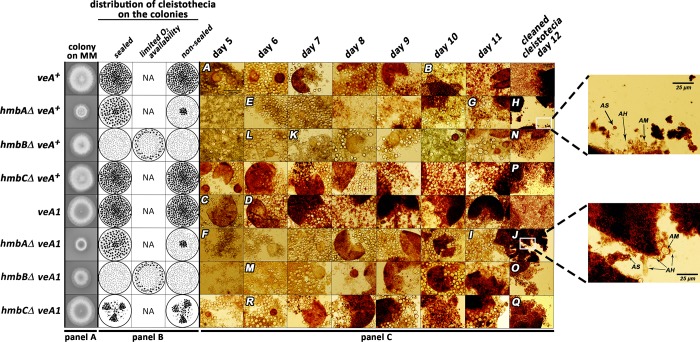
Fig 1. Documentation of sexual structures formed during the course of sexual development in control and hmbA, hmbB and hmbC deletion strains.
Panel A: Growth ability of veA+ and veA1 controls and the hmbAΔ, hmbBΔ and hmbCΔ strains in both veA+ and veA1 background. The strains were incubated on CM for 2 days at 37°C prior documentation. Strains used: veA+ control (HZS.450), veA1 control (HZS.145), hmbAΔ veA+ (HZS.521), hmbAΔ veA1 (HZS.239), hmbBΔ veA+ (HZS.495), hmbBΔ veA1 (HZS.280), hmbCΔ veA+ (HZS.531), hmbCΔ veA1 (HZS.338). The complete genotypes are listed in S2 Table. Panel B: Schematic representation of oxygen regulated distribution pattern of cleistothecia in control and hmbAΔ, hmbBΔ and hmbCΔ strains. “Sealed” and “non-sealed” refer to conditions where plates are sealed with scotch tape or kept without sealing, respectively. “Limited oxygen availability” refers to the non-sealed condition with the applied medium almost entirely filling up the Petri dish. Small-sized grey dots mark micro-sized cleistothecia, black dots indicate normal-sized cleistothecia. Panel C: Time course of sexual structure formation in control and hmbA, hmbB and hmbC deletion strains. Selfing was done on CM at 37°C in complete darkness. In the case of hmbBΔ strains (both veA+ and veA1) the plates remained non-sealed and the medium almost entirely filled up the Petri dish. The rest of the selfing plates were sealed by scotch tape. Samples from the areas showing sexual development were taken each day from day 5 until day 11, and were studied without purification by using microscope. Cleistothecia collected from day 12 were purified on a sterile agar plate prior to mounting. Letters A-R correspond to images with landmark structures discussed in the Results section. Images A, E, F, K, L, M and R show primordia, image C shows μ-cleistothecium, images B, D, G, H, I, J, N, O, P and Q show cleistothecia with mature ascospores. These sexual structures can also be observed in the non-marked images. Images were taken by an Olympus BX51 microscope. The 100 μm scale bar shown on image A refers to all images except those in the day 12 column and magnifications of selected area on images I and K. The strains used in the experiment are the same as those listed in Panel A.

